


A rapidly changing rate environment can make fixed income performance more confusing. Laddered bond portfolios aim to make income more predictable—so what’s happening when income and yield diverge? We explain why this divergence is often quite predictable indeed.
For fixed income investors, a ladder portfolio can offer predictable income and principal preservation. But when interest rates change rapidly, new ladder investors may question why their coupon income is materially different than the yield on their recently acquired positions. To figure out why this occurs, we need to understand how a bond’s coupon rate gets set at issuance and how its yield changes under shifting market conditions—most notably a rising rate environment.
How have rising interest rates affected Treasury bond yields?
The Federal Reserve’s fight to bring inflation back to target has led to an extremely rapid rise in interest rates. High inflation was initially considered transitory in nature and attributed to pandemic-related supply issues. But as the consumer price index surged toward 9%—a level last seen during the early 1980s—and unemployment fell to under 4%, the Fed began aggressively raising rates at its March 2022 meeting. We’ve since seen nine rate increases, ranging from 0.25% to 0.75%, which has pushed the Fed’s policy rate from 0.25% to 5.00%.
The Fed has indicated its continued commitment to fighting inflation, and its actions appear to be working. Markets are now pricing in a rate cut later this year as consumer price increases moderate and the financial sector grapples with the sudden collapse of Silicon Valley Bank. Against this backdrop, the yield on the two-year US Treasury note jumped by over 2.50%, while the five-year rate increased by almost 2.00%.
US Treasury yield curve, February 2022–March 2023
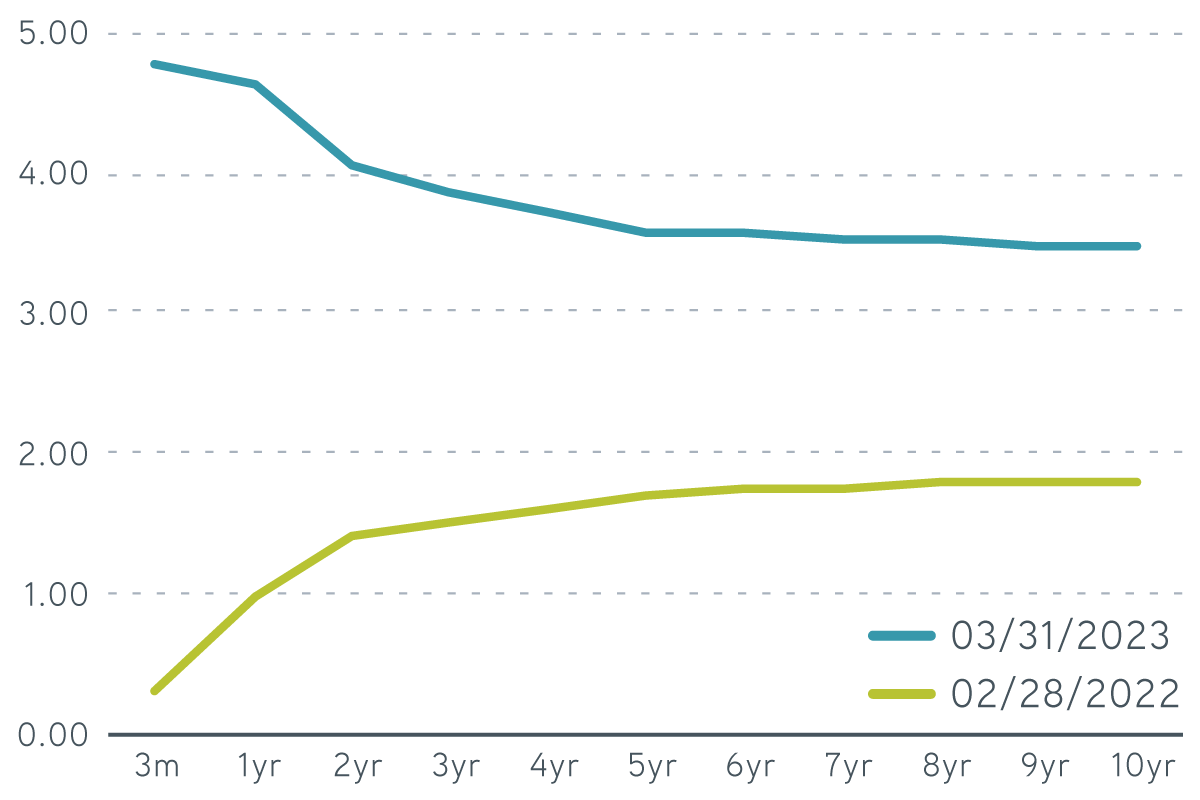
Source: Bloomberg, 3/31/2023. For illustrative purposes only. Not a recommendation to buy or sell any security.
The sharp increase in interest rates has created a significant disconnect between a ladder’s yield and its coupon rate. Since the eligible securities available constrain a ladder, a long period of stable rates followed by a large change can create a situation in which the ladder’s average coupon rate is significantly different than its yield.
How is a bond’s coupon rate set?
The US government has issued debt obligations with a wide range of terms over the years. Ladder investors tend to prefer fixed-rate Treasury notes because of their reliable coupon income. All US Treasury notes pay semiannual coupons, and all have repaid their principal in full at maturity. The amount of cash flow a Treasury note generates is a function of its coupon rate, which is set when the security is issued. The frequency of issuance varies by maturity, ranging from monthly for two-year and five-year Treasury notes to quarterly for 10-year and 30-year bonds. It can therefore take time for a note to become available with a coupon rate equal to the prevailing yield at each maturity point. This is especially true for one- to 12-month ladders.
Each newly issued Treasury note is assigned a coupon rate very close to the prevailing market yield for that specific maturity. If two-year secondary market rates are 4.00%, for example, it’s likely that the coupon on the new-issue two-year note will be very near 4.00% as well. As a result, newly issued notes typically trade very close to par ($100). After the issuance date, the coupon rate remains the same, but the price of the security adjusts to reflect changes in prevailing-market interest rates. The price of the security falls when rates rise, and the price of the security rises when rates fall. It’s important to note that the cash flow that a particular fixed-rate security generates is determined by its initial coupon and is fixed over the life of the security.
Since investors purchase the rungs of a ladder in the secondary market, their investment choices are limited to existing issues. Some will bear coupons near the current secondary-market yield, but most will have been issued when rates were either higher or lower. If rates have risen sharply, as they have over the past year, the difference between the market yield and the coupon rate can be large. For example, there are currently six Treasury issues maturing in November 2024. They range from a 1994 note with a 7.50% coupon to a 2021 note with a 0.75% coupon. Because rates are much lower than when the 1994 issue was auctioned, it trades at a five-point premium to par ($105). Conversely, because rates have risen significantly since the 2021 issue was auctioned, it now trades at a six-point discount to par ($94).
Flexible fixed income solutions for turbulent times
How is a bond’s yield calculated?
Yield is a convenient way to compare the expected returns of bonds with different coupon rates and maturity dates. By definition, yield is the annualized internal rate of return used to discount a bond’s cash flows so that their present values sum to its price. A more practical approach is to think of a bond’s yield as including both the coupon income and the difference between the bond’s purchase price and its ultimate value of par at maturity.
For instance, the yield of a one-year Treasury note with a 2% coupon, trading at $98 and yielding 4%, would be composed of the income generated by the 2% coupon and the appreciation from $98 to $100 at maturity. In the case of a premium security, the yield is composed of the coupon income and the deduction of the difference between its purchase price and par. For bonds that mature in more than a year, the price change is calculated on an annual basis. A 2% coupon note maturing in two years that yields 4% would be priced at approximately $96.
For monthly ladders, some portfolio summary statistics can be challenging to interpret due to the recent rate move and the way yield is calculated on an annual basis. For bonds maturing in less than a year, it may take only a small price discount for a low-coupon bond to produce a much higher yield. For instance, one might expect a one- to 12-month ladder, with each rung comprised of a 2% coupon bond yielding 4%, to have an average price of $98. But as we can see in the table, the average price is actually closer to $99 due to the front-end bonds being valued so close to par.
Examples of coupon rates and yields at different maturities
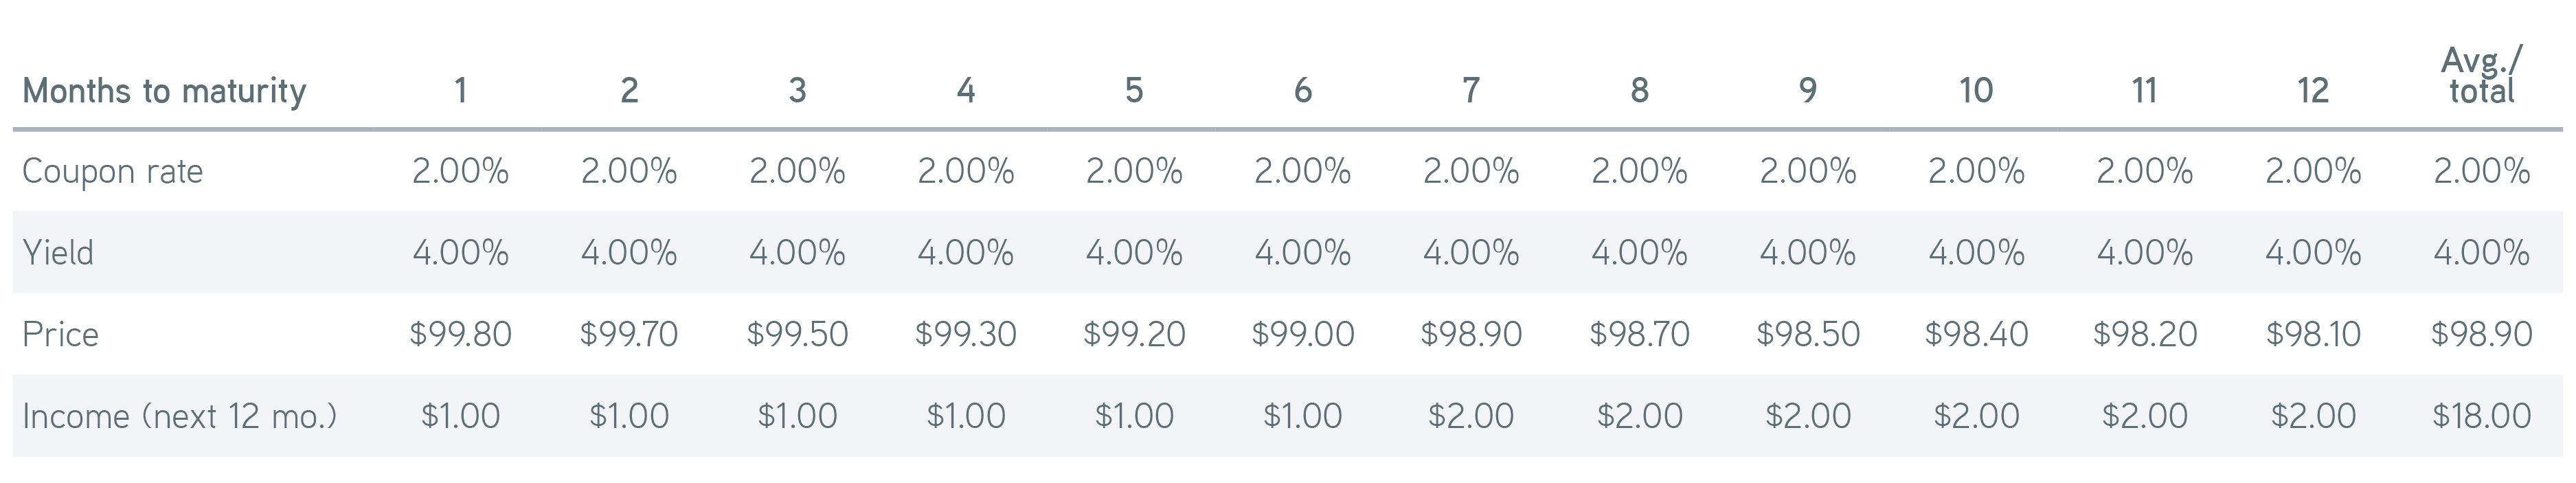
Source: Parametric, 3/31/2023. For illustrative purposes only. Not a recommendation to buy or sell any security. Does not reflect the experience of any investor and should not be relied on for investment decisions.
Also, the coupon income that a monthly ladder is expected to generate over the coming year will appear understated, since the bonds maturing in the coming six months will only make only one coupon payment. The advantage of the ladder strategy is that it reinvests these proceeds. Under a stable rate environment, its average coupon rate converges to the yield of the longest rung.
The bottom line
While a bond’s coupon rate doesn’t change over time, its price will adjust to reflect the prevailing yield that investors are willing to pay for a security of that maturity. Due to the jump in interest rates over the past year, the average coupon rate of bonds held in a monthly Treasury ladder can be materially lower than their yield. However, the two should converge over time as more newly issued bonds become available to purchase. If interest rates level off, a ladder’s average coupon will steadily increase, and eventually the difference with its average yield will disappear. If recent interest rate volatility continues, coupon rates could continue to vary significantly from yield.