

Weekly Fixed Income Insights
Track what matters in fixed income: Macro news, policy moves and developments in the municipal and corporate markets.
FOMC Recap
April 30, 2026
Fixed income portfolio manager Kevin Lynyak recaps the FOMC meeting and bond market reaction. Listen now:
Warsh Delay: What, Now What, So What for Rates
April 22, 2026
Fixed income portfolio manager Kevin Lynyak shares his insights into the current bond market. Listen now:
May 19, 2026
Macro update
Rates broke decisively higher last week as inflation fears, oil prices and global duration selling overwhelmed the prior “carry/rangebound” regime. The two-year U.S. Treasury rose 18 basis points (bps), the 10-year rose 24 bps to 4.59% (highest since 2025) and the 30-year rose 18 bps to 5.12%, breaking above the post-COVID highs (Bloomberg, 5/15/26).
Inflation reaccelerated materially, as both April headline Consumer Price Index (CPI) and core CPI accelerated beyond consensus expectations. The Producer Price Index (PPI) was even hotter, registering the strongest monthly increase since 2022. The data reinforced concerns that the Iran-related oil shock is having an impact beyond energy on broader services, transportation and production costs (Bloomberg, 5/15/26).
West Texas Intermediate finished above $105, while Brent Crude pushed above $109. The Strait of Hormuz remained effectively closed and oil inventories continued drawing lower. Markets increasingly view the U.S.-Iran conflict not simply as a geopolitical risk premium, but as a direct inflation and term-premium shock feeding into rates, consumer expectations, transportation costs and producer prices (Bloomberg, 5/15/26).
The Fed narrative may be shifting from delayed easing toward possible tightening, and Kevin Warsh officially became Fed chair last week. The fed funds futures markets moved toward assigning meaningful odds of a hike into 2027, while economists pushed expected easing/cuts further out (Bloomberg, 5/15/26).
This week’s economic data is scheduled to feature housing data, purchasing managers’ indexes, University of Michigan sentiment and the minutes from the April Federal Open Market Committee meeting on Wednesday, which will likely be the highlight of the week. Market pundits will likely focus on the hawkish voting members in the Fed, debate around removing the easing bias and whether recent inflation/oil developments materially shift the committee’s outlook and actions (Bloomberg, 5/15/26).
Municipal bond update
AAA municipal yields grew sharply higher across the curve last week. Two- and five-year yields increased 12 and 13 bps, respectively, while 10- and 30-year yields rose 13 and 15 bps, respectively. This sizable price action left these benchmarks at 2.57%, 2.73%, 3.09% and 4.46%, respectively (LSEG, 5/15/26).
Five- to 20-year A-rated muni yields closed last week, ranging from 2.93% to 4.37%, with related taxable-equivalent yields ranging from 4.95% to 7.38%, assuming a combined federal tax rate of 40.8% (Parametric, LSEG, 5/15/26).
Muni mutual funds saw massive inflows again last week, at $1.3 billion. ETFs attracted $809 million and open-end funds gained $541 million (Lipper, JPMorgan, 5/13/26).
Tax-exempts outperformed Treasurys last week, with the Bloomberg Municipal Bond Index declining 0.59%, compared to a 1.11% decrease for the Bloomberg U.S. Treasury Index. Munis are now up 0.59% year to date (YTD), while Treasurys are down 0.96% (Bloomberg, 5/15/26).
Muni issuance steps up its $10 billion weekly trend line this week, with $13.5 billion scheduled to enter the primary market and follows a pair of 12s over the last two weeks (Ipreo, 5/8/26).
Municipal Index Yield to Worst
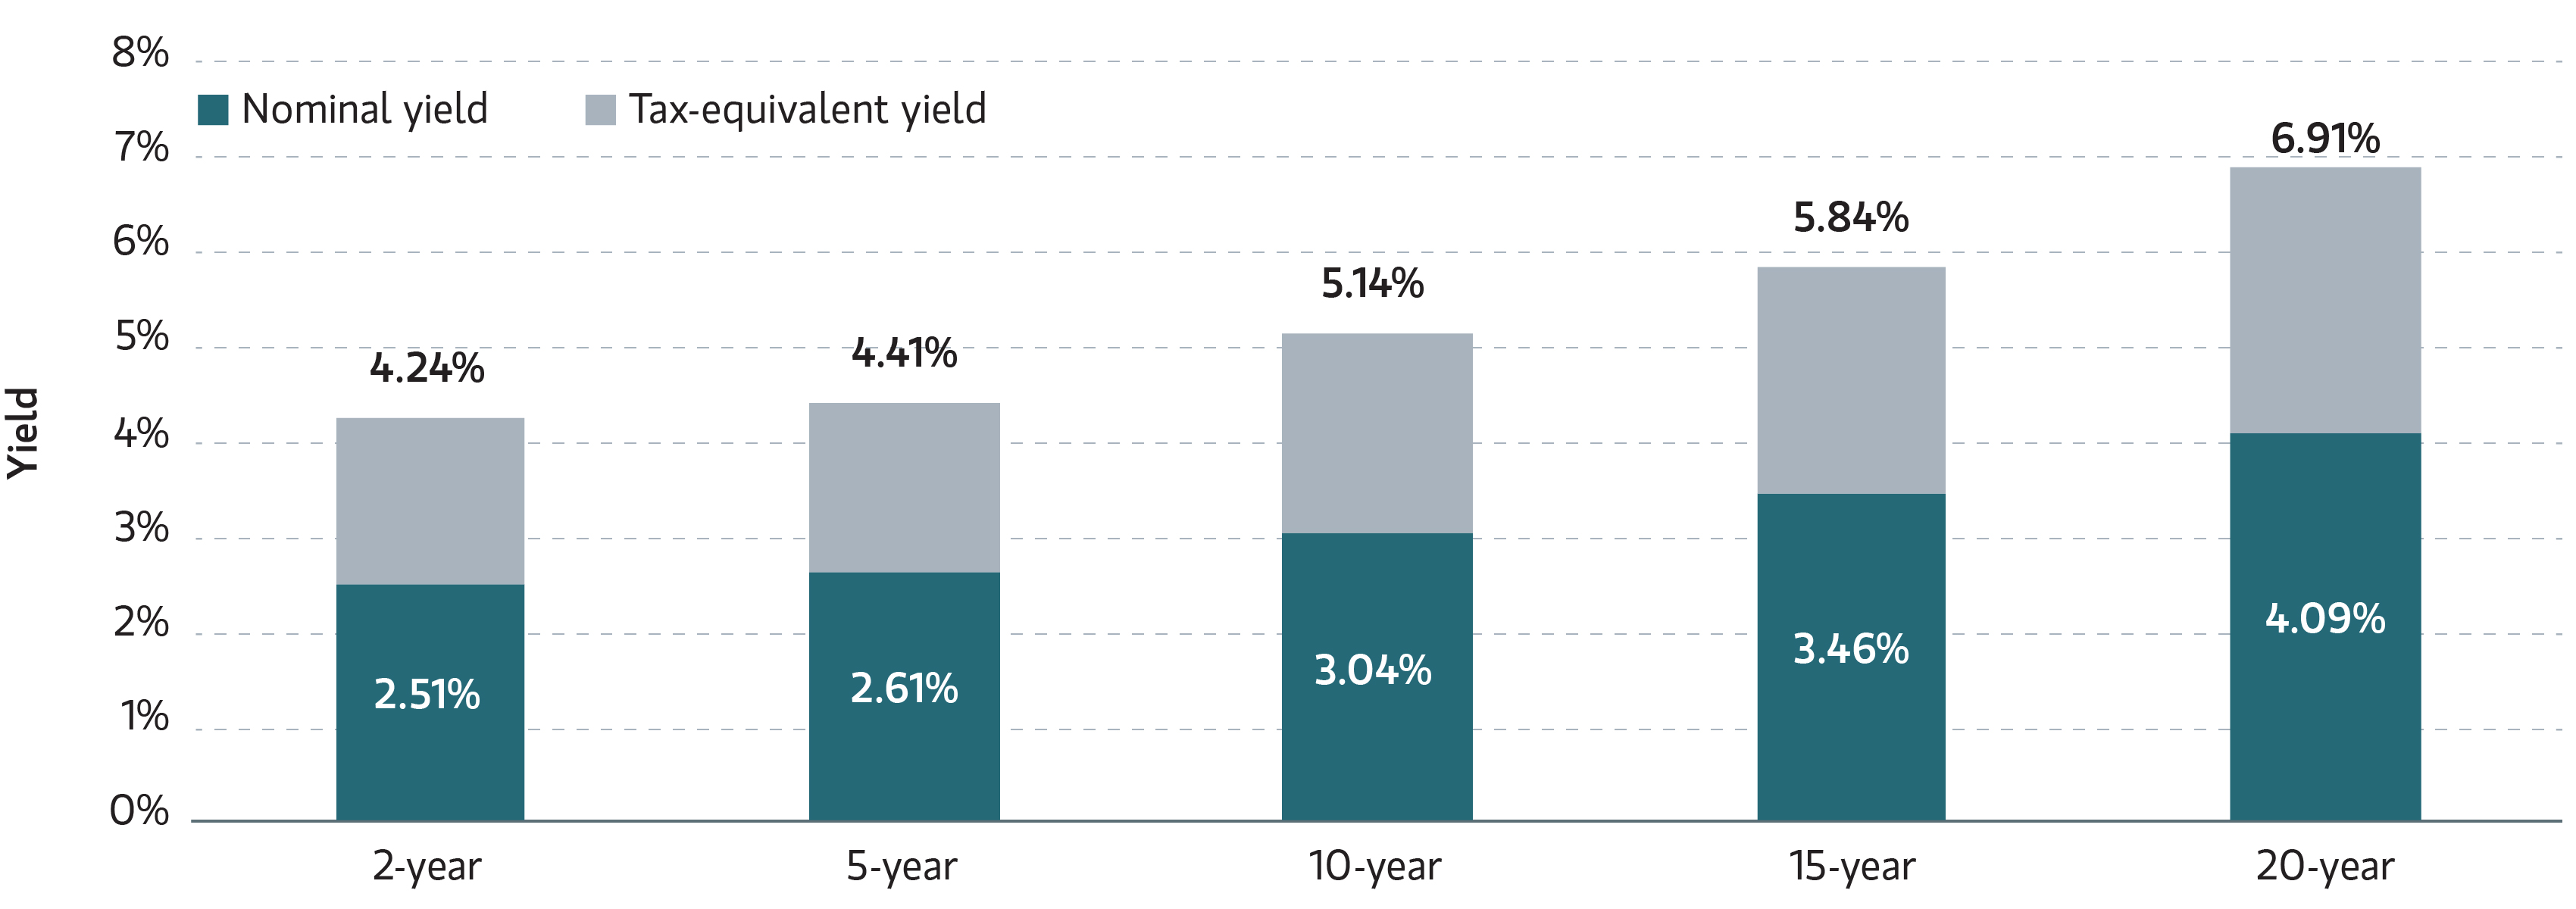
Sources: LSEG, Parametric, 5/19/2026. Assuming a top federal tax rate of 37%, plus 3.8% net investment income tax rate, 40.8% combined. For illustrative purposes only. It is not possible to invest directly in an index. Past performance is no guarantee of future results.
Corporate bond update
The ICE BofA 1-10 Year US Corporate Index returned -0.67% for the week and -0.40% month to date. The index outperformed like-duration Treasurys by 0.16% for the week and by 0.29% month to date (Bloomberg, 5/15/26).
U.S. investment-grade (IG) corporate yields increased across the curve last week. Two-, five- and 10-year yields rose 14, 20 and 20 bps, respectively.
Corporate yields are higher YTD, with two-, five- and 10-year yields up 49, 50 and 42 bps, respectively (Bloomberg, 5/15/26).
IG mutual funds and ETFs experienced inflows of $9.3 billion, a decrease from the previous week’s inflows of $12.8 billion. Corporate-only funds experienced inflows of $3.4 billion, following the previous week’s inflows of $1.7 billion (JPMorgan, 5/15/26).
Corporate one- to 10-year IG bond yields, which have increased 49 bps YTD, ended last week at 5% (Bloomberg, 5/15/26).
Corporate Index Yield to Worst
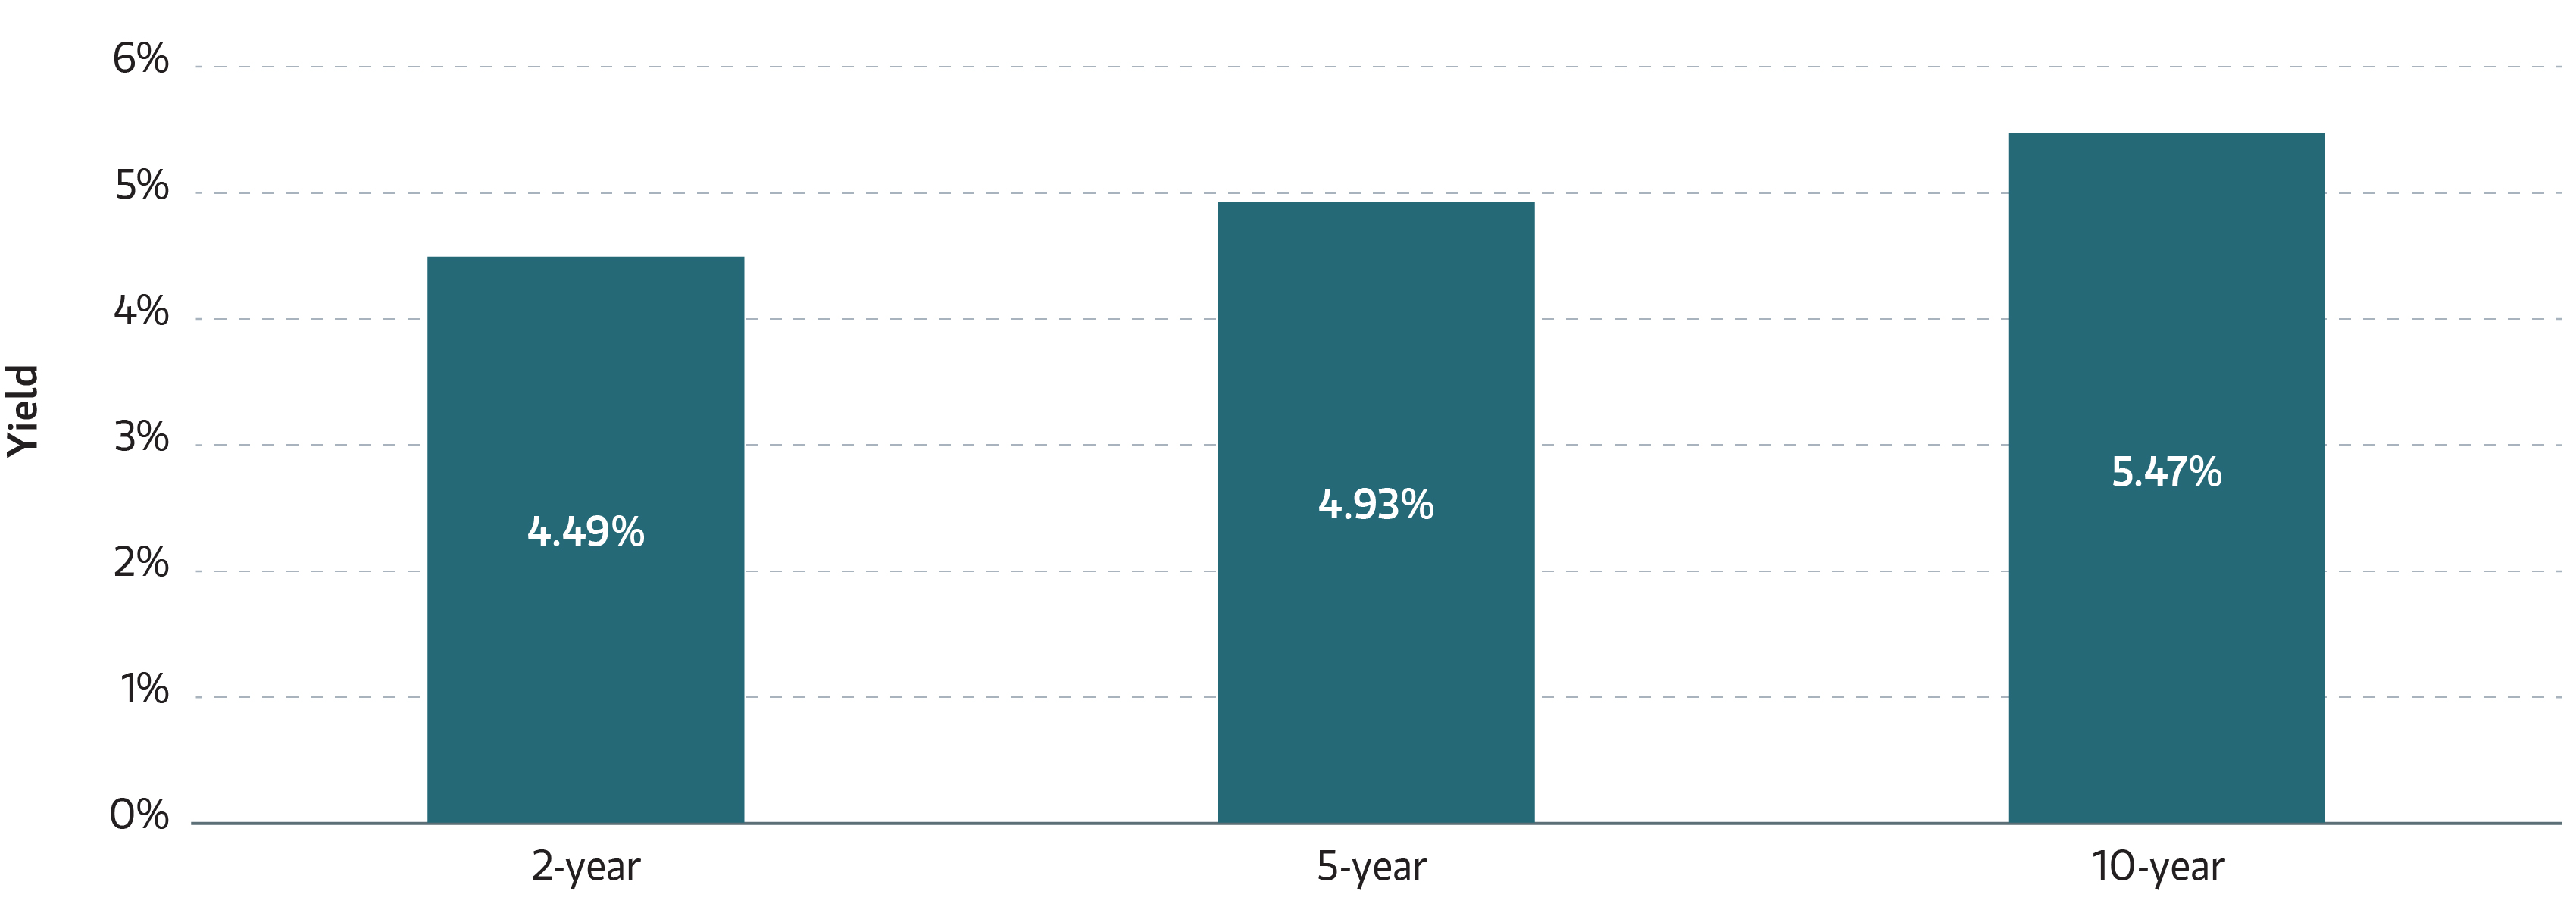
Source: Bloomberg as of 5/19/2026. Past performance is no guarantee of future results. The index performance is provided for illustrative purposes only and is not meant to depict the performance of a specific investment.
Investing in fixed income securities involves risk. All investments are subject to loss. Learn more.
ADVISOR TOOL
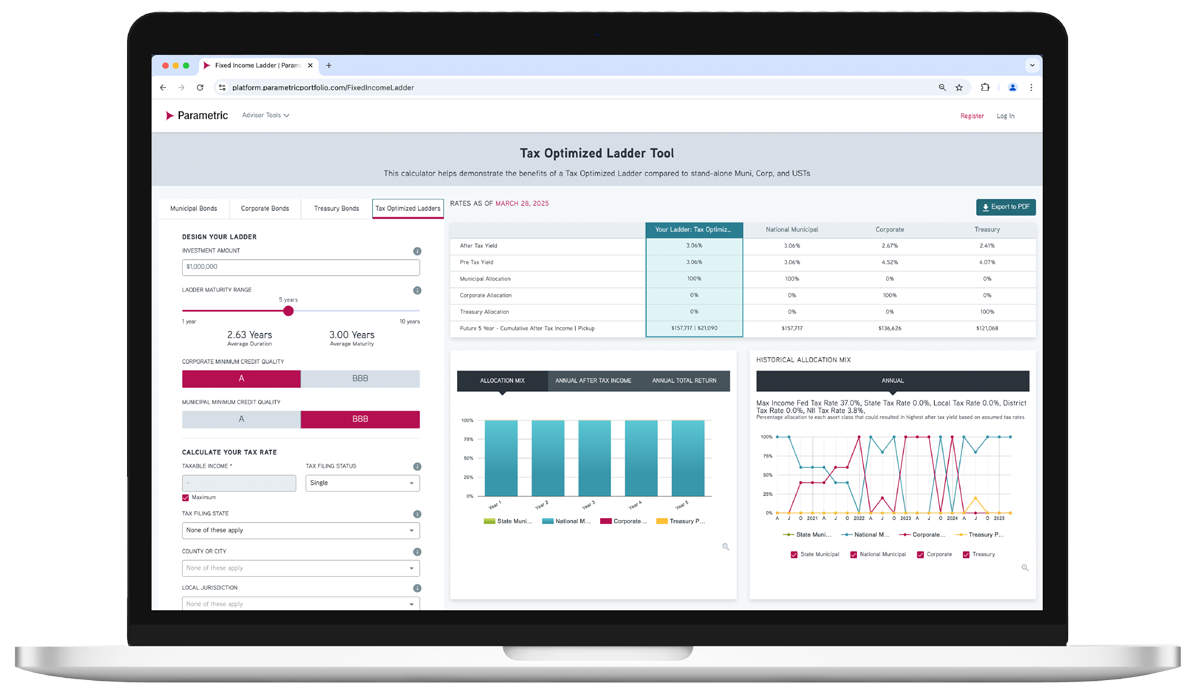
Laddered Interest Rate Scenario Tool
Which fixed income asset class is just right for each investor? Explore possible ways to achieve optimal after-tax yield.
Use our online tool to showcase potential benefits of tax-managed and customized laddered bond portfolios.
Featured Content

Corporate Bond Market Insight - The Fed Sees Dissents Amid a Fluctuating Economy
Review the US corporate fixed income market and see what’s ahead for investment-grade and high-yield bonds.
Municipal Bond Market Insight - The Comeback and the Clock
Look back at the month in munis and find out what may be coming for taxable and tax-exempt bonds.
Preferred Securities Market Insight - Rates Rally, Spreads Tighten and Preferreds Rebound
Find out how preferred securities performed this month and where we’re seeing potential for the next month.
Related Content
9/3/2025

8/27/2025

Explore all fixed income solutions
Get in touch
Discover how our fixed income solutions can address today’s challenges. Request a sample portfolio or transition analysis.