
Weekly Fixed Income Insights
Track what matters in fixed income: Macro news, policy moves and developments in the municipal and corporate markets.
The Treasury-Fed Accord and Kevin Warsh
June 17, 2026
Fixed income portfolio manager Kevin Lynyak discusses the possibility of a new Treasury-Fed Accord. Listen now:
Why Are Treasury Yields Rising?
June 8, 2026
Fixed income portfolio manager Kevin Lynyak talks about the steady rise in Treasury yields. Listen now:
June 17, 2026
Macro update
Fixed income markets began the week with a cleaner geopolitical backdrop following the US-Iran ceasefire framework and agreement to reopen the Strait of Hormuz. Oil prices moved sharply lower to a three-month low, easing pressure on the near-term inflation narrative and supporting the rally in duration and risk assets.
Inflation data presented a more balanced picture than headline figures suggested. May Consumer Price Index (CPI) increased 0.5% month over month (MoM) and 4.2% year over year (YoY), with energy accounting for more than 60% of the monthly increase. Core CPI rose a more moderate 0.2% MoM and 2.9% YoY, supported by continued moderation in shelter and contained core goods prices (Bloomberg, 6/12/2026).
Producer price data reinforced the market’s focus on core services inflation and the outlook for personal consumption expenditures. The data suggested pipeline inflation pressures remain uneven, with services categories still firm even as the reversal in energy prices should help ease some pressure on future headline inflation readings.
Federal Reserve communication remains the key near-term catalyst. A policy hold at chair Kevin Warsh’s first Federal Open Markets Committee (FOMC) meeting appears highly likely, but investors will focus on the updated dot plot, the summary of economic projections and whether the Fed removes its easing bias while maintaining a patient, higher-for-longer stance.
We remain constructive on high-quality fixed income. The Iran ceasefire and oil reversal provide a welcome inflation reprieve, but they don’t end the policy debate. If the Strait of Hormuz remains open and energy prices continue to normalize, May’s headline CPI reading could represent the cyclical peak for inflation this year, allowing investors to refocus on growth, productivity and the evolving Fed reaction function.
Municipal bond update
AAA municipal yields rose across the curve last week. Two-, five-, 10- and 30-year yields rose one, six, four and two basis points (bps), respectively. This price action left these benchmarks at 2.39%, 2.64%, 2.99% and 4.32%, respectively (LSEG, 6/12/2026).
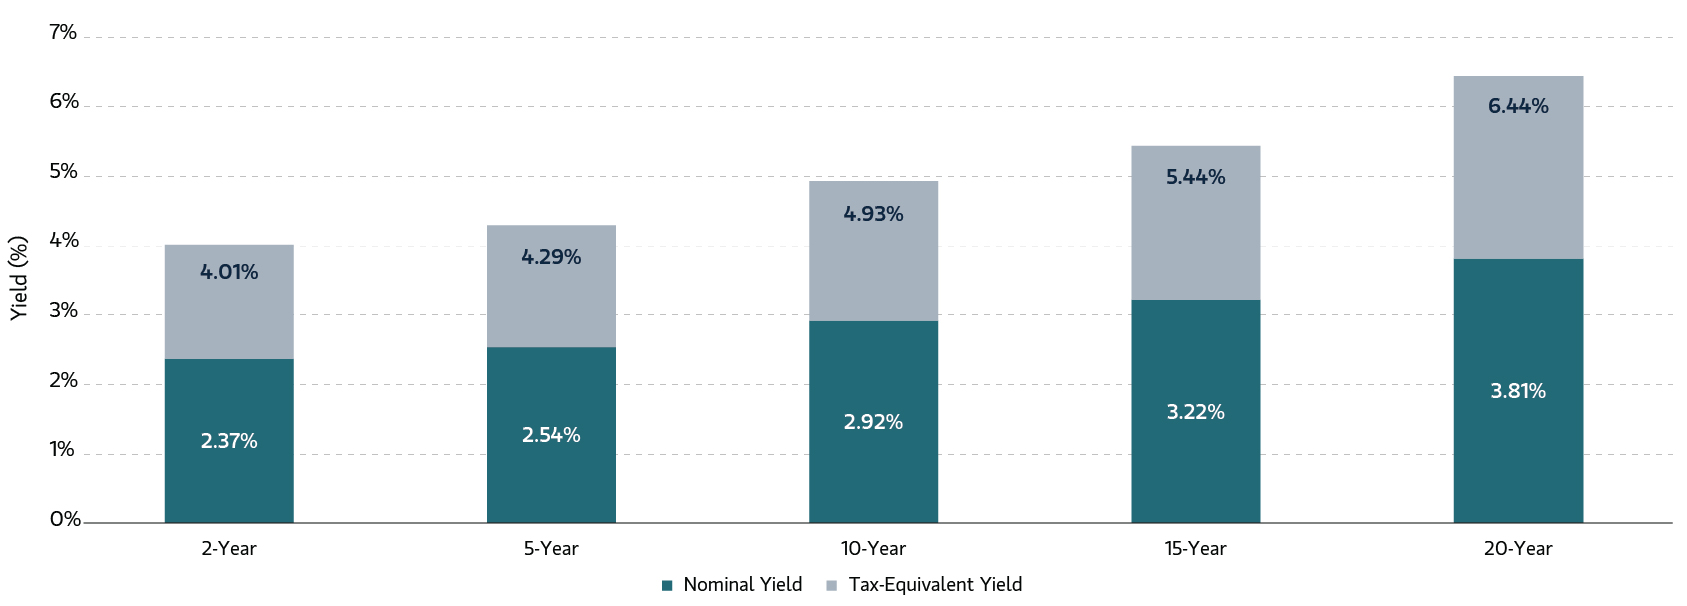
Five-, 10-, 15- and 20-year A-rated muni yields closed last week at 2.84%, 3.3%, 3.73% and 4.23%, respectively, with related taxable-equivalent yields of 4.8%, 5.57%, 6.3% and 7.15%, respectively, assuming a combined federal tax rate of 40.8% (Parametric, LSEG, 6/12/2026).
Muni bond fund inflows moderated as of June 10, totaling $625 million. ETFs attracted $557 million, while open-end funds received only $68 million, reflecting a slower but still positive demand backdrop for the asset class (Lipper, JPMorgan, 6/10/2026).
Muni bond performance remains positive year to date (YTD), with munis returning 1.62% YTD after declining 12 bps week over week. US Treasurys are down 0.03% YTD after gaining 44 bps week over week. This leaves munis outperforming Treasurys by 165 bps YTD (Bloomberg, 6/12/2026).
New issuance scheduled for this week eases to $9 billion, reflecting both the mid-week FOMC meeting and the end-of-week holiday (Ipreo, 6/12/2026).
Sources: LSEG, Parametric, 6/12/2026. Assuming a top federal tax rate of 37%, plus 3.8% net investment income tax rate, 40.8% combined. For illustrative purposes only. It is not possible to invest directly in an index. Past performance is no guarantee of future results.
Corporate bond update
The ICE BofA 1-10 Year US Corporate Index returned 0.41% for the week and -0.07% month to date (MTD). The index outperformed like-duration Treasurys by 0.03% for the week and by 0.01% MTD (Bloomberg, 6/12/2026).
US investment-grade (IG) corporate yields decreased across the curve last week. Two-, five- and 10-year yields fell seven, nine and eight bps, respectively. Corporate yields are higher YTD, with two-, five- and 10-year yields up 46, 43 and 30 bps, respectively (Bloomberg, 6/12/2026).
IG mutual funds and ETFs experienced inflows of $8.5 billion, a decrease from the previous week’s inflows of $15.3 billion. Corporate-only funds experienced inflows of $2.4 billion, following the previous week’s inflows of $2.6billion (JPMorgan, 6/12/2026).
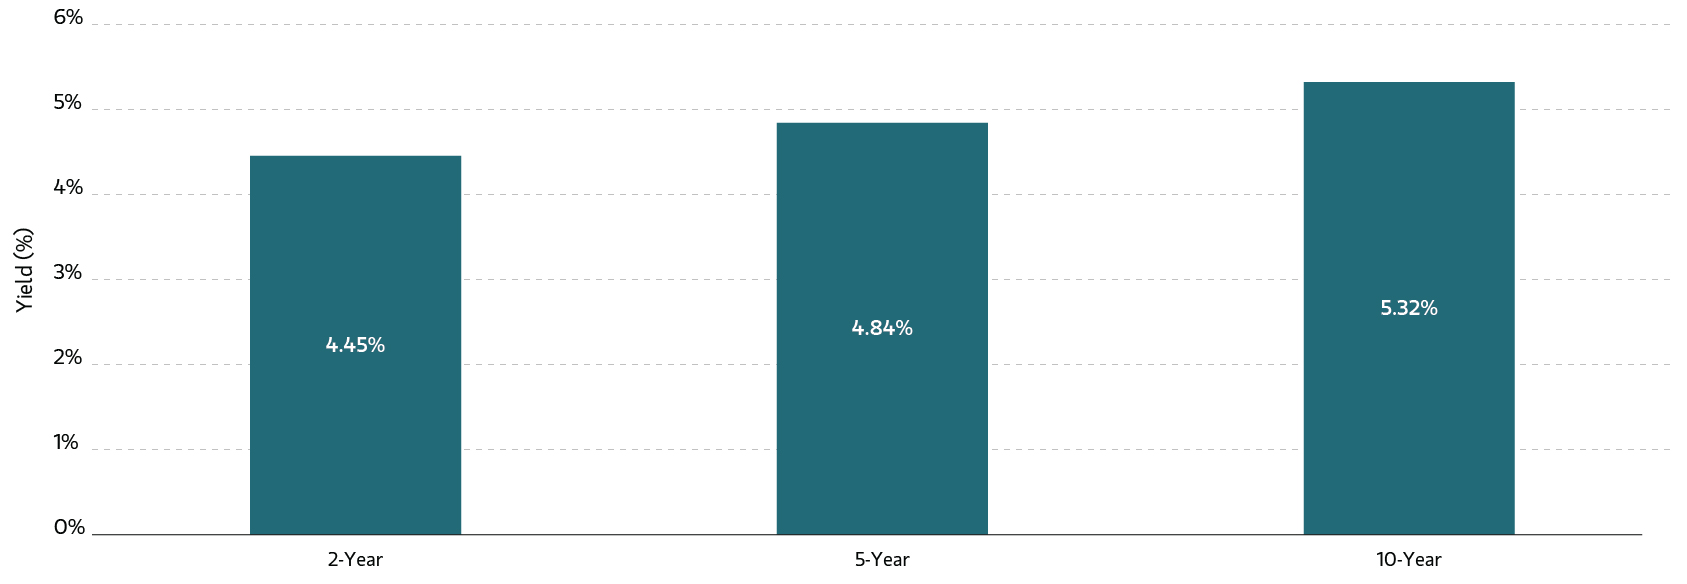
Corporate one- to 10-year IG bond yields, which have increased 43 bps YTD, ended last week at 4.9% (Bloomberg, 6/12/2026).
Corporate Index Yield to Worst
Source: Bloomberg as of 6/12/2026. Past performance is no guarantee of future results. The index performance is provided for illustrative purposes only and is not meant to depict the performance of a specific investment.
Investing in fixed income securities involves risk. All investments are subject to loss. Learn more.
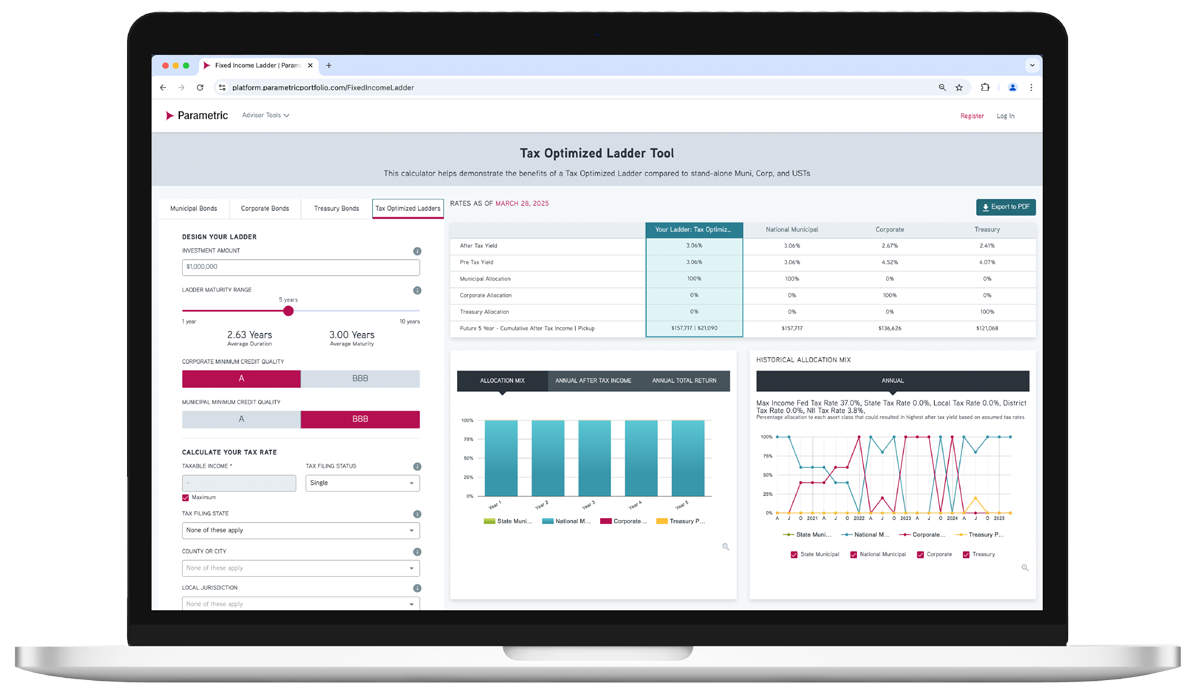
ADVISOR TOOL
Laddered Interest Rate Scenario Tool
Which fixed income asset class is just right for each investor? Explore possible ways to achieve optimal after-tax yield.
Use our online tool to showcase potential benefits of tax-managed and customized laddered bond portfolios.
Featured Content
Corporate Bond Market Insight - Rising Prices, Resilient Credit and A Reduced Fed Footprint
Review the US corporate fixed income market and see what’s ahead for investment-grade and high-yield bonds.
Municipal Bond Market Insight - Shift at Hand
Look back at the month in munis and find out what may be coming for taxable and tax-exempt bonds.
Preferred Securities Market Insight - A Tale of Two Preferred Markets
Find out how preferred securities performed this month and where we’re seeing potential for the next month.
Related Content
9/3/2025

8/27/2025

Explore all fixed income solutions
Get in touch
Discover how our fixed income solutions can address today’s challenges. Request a sample portfolio or transition analysis.