
Weekly Fixed Income Insights
Track what matters in fixed income: Macro news, policy moves and developments in the municipal and corporate markets.
Warsh Delay: What, Now What, So What for Rates
April 22, 2026
Fixed income portfolio manager Kevin Lynyak shares his insights into the current bond market. Listen now:
FOMC Recap
April 30, 2026
Fixed income portfolio manager Kevin Lynyak recaps the FOMC meeting and bond market reaction. Listen now:
June 3, 2026
Macro update
Treasury yields moved lower across the curve last week as easing Middle East tensions prompted investors to unwind geopolitical risk premiums. The 10-year Treasury yield declined approximately 12 basis points (bps) to 4.43%, while markets continued to balance resilient economic data against expectations for a higher-for-longer Federal Reserve policy backdrop (Bloomberg, 5/29/2026).
Credit markets remained exceptionally firm. Investment-grade (IG) spreads tightened to levels near post-2000 lows, while all-in yields remained attractive. High yield spreads reflect continued investor demand for income and credit exposure (Bloomberg, 5/29/2026).
Primary market activity remained robust, with approximately $41 billion of IG corporate issuance pricing during the week. New-issue volume remains roughly 25% ahead of last year's pace as issuers continue to take advantage of favorable funding conditions and strong investor demand (Bloomberg, 5/29/2026).
Equity markets extended their advance. Artificial intelligence (AI) remained the dominant investment theme, with continued strength across semiconductors, cloud infrastructure, memory, hardware and software. Recent results from several AI-linked companies reinforced expectations for sustained enterprise technology spending (Bloomberg, 5/29/2026).
Looking ahead, investor attention turns to a busy economic calendar featuring both Institute for Supply Management (ISM) Manufacturing and Services, Job Openings and Labor Turnover Survey (JOLTS) job openings, ADP employment, jobless claims and the May employment payroll situation report on Friday. Labor market data will remain central to assessing the durability of economic growth, the inflation outlook and expectations for Fed policy ahead of the June 17 Federal Open Markets Committee meeting (Bloomberg, 5/29/2026).
Municipal bond update
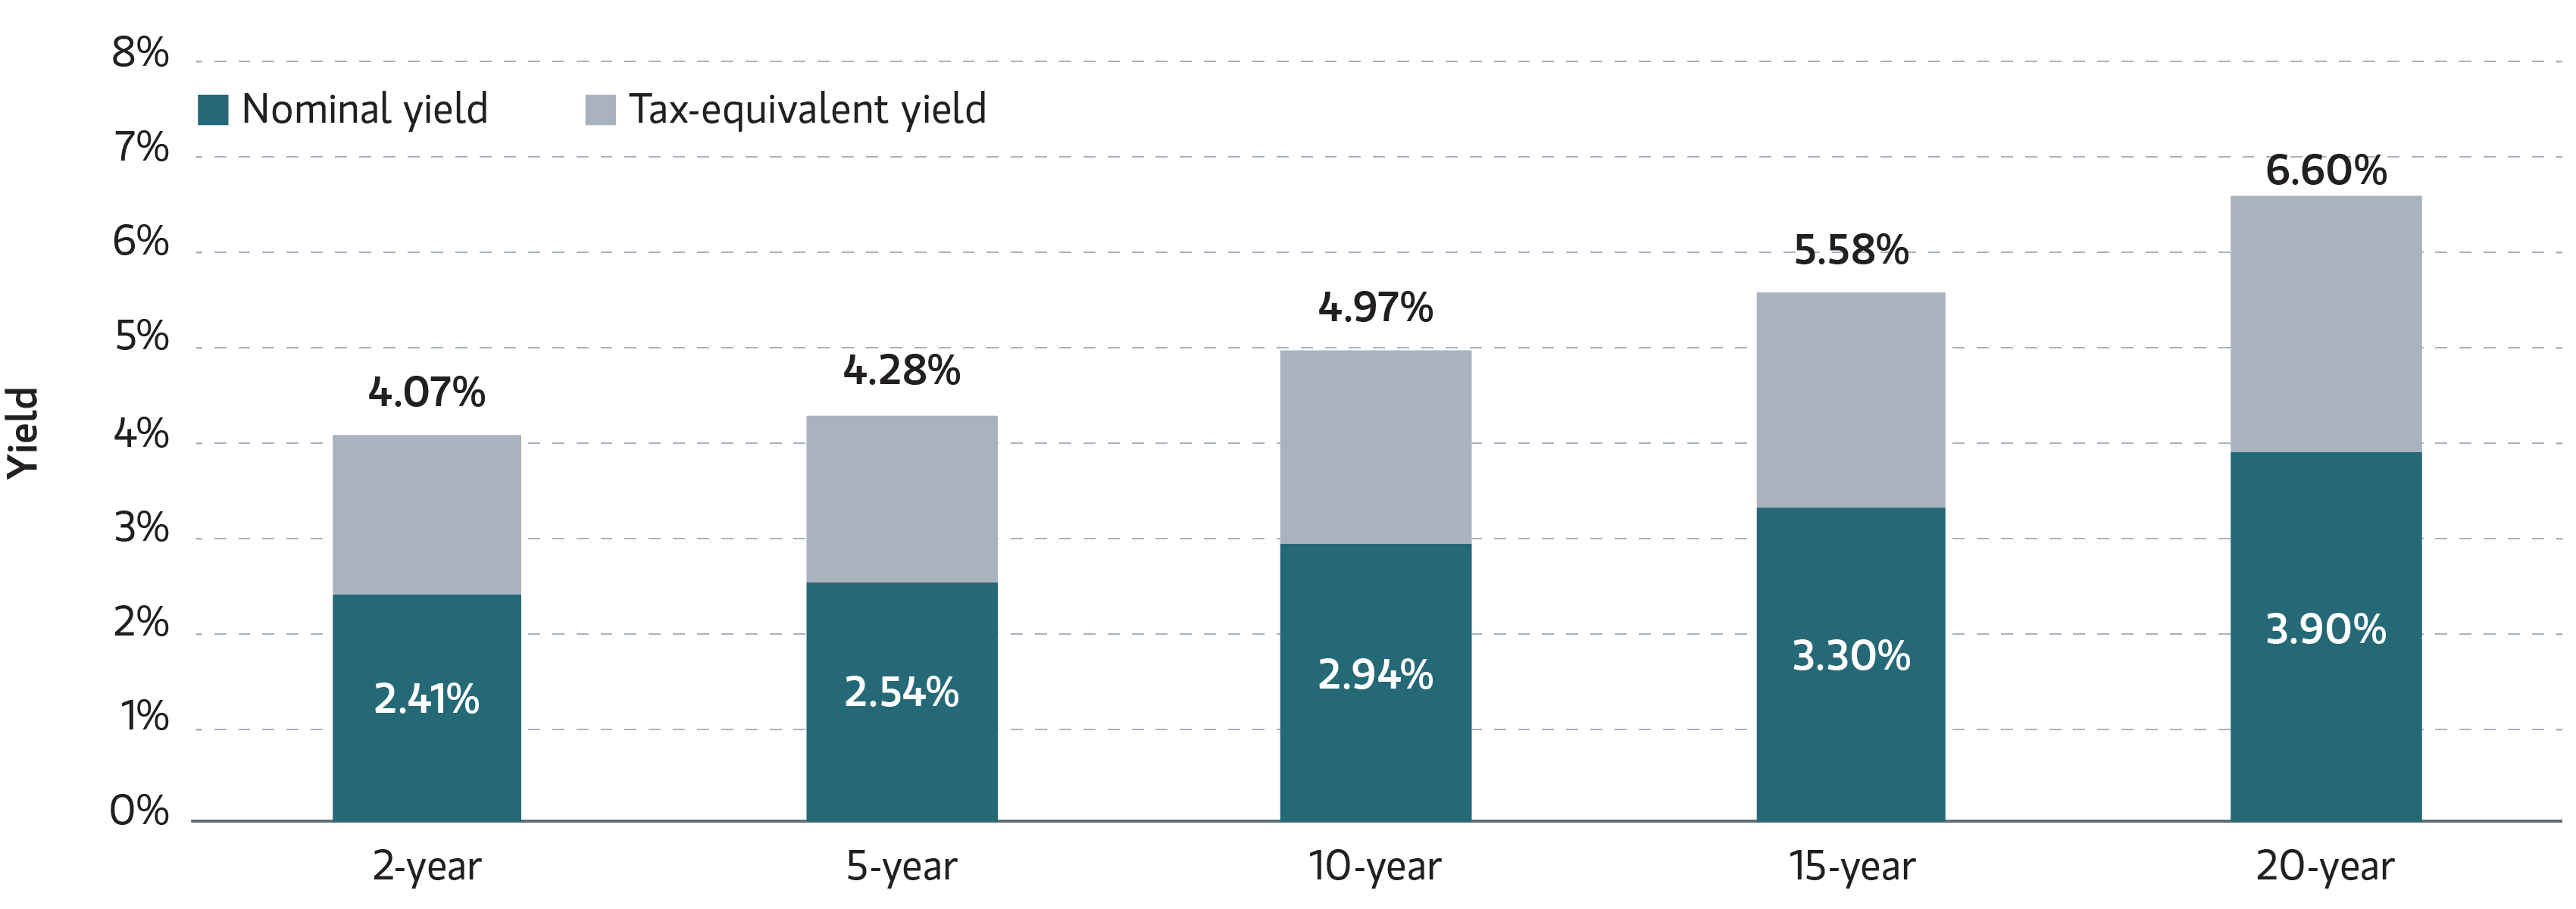
AAA municipal yields declined sharply across the curve last week. Two- and five-year yields were both lower by 15 bps, while 10- and 30-year yields both dipped by 16 bps. This impressive price action leaves these benchmarks at 2.42%, 2.62%, 2.98% and 4.34%, respectively (LSEG, 5/29/2026).
Five- to 20-year A-rated muni yields closed last week ranging from 2.82% to 4.27%, with related taxable-equivalent yields ranging from 4.76% to 7.21%, assuming a combined federal tax rate of 40.8% (Parametric, LSEG, 5/29/2026).
Muni mutual funds saw near-record inflows last week of $2.3 billion, the second largest ever recorded. ETFs captured $1.7 billion, while open-end funds attracted $671 million (Lipper, JPMorgan, 5/27/2026).
Tax-exempt bonds outperformed Treasurys last week, with the Bloomberg Municipal Bond Index gaining 1.03%, compared to a 0.78% gain for the Bloomberg US Treasury Index. Munis are now up 1.34% year to date (YTD), and Treasurys are flat, at 0.00% (Bloomberg, 5/29/2026).
Muni issuance this week spikes to approximately $17 billion, representing a spring-back from last week’s holiday-impacted $7 billion calendar (Ipreo, 5/29/2026).
 Municipal Index Yield to Worst
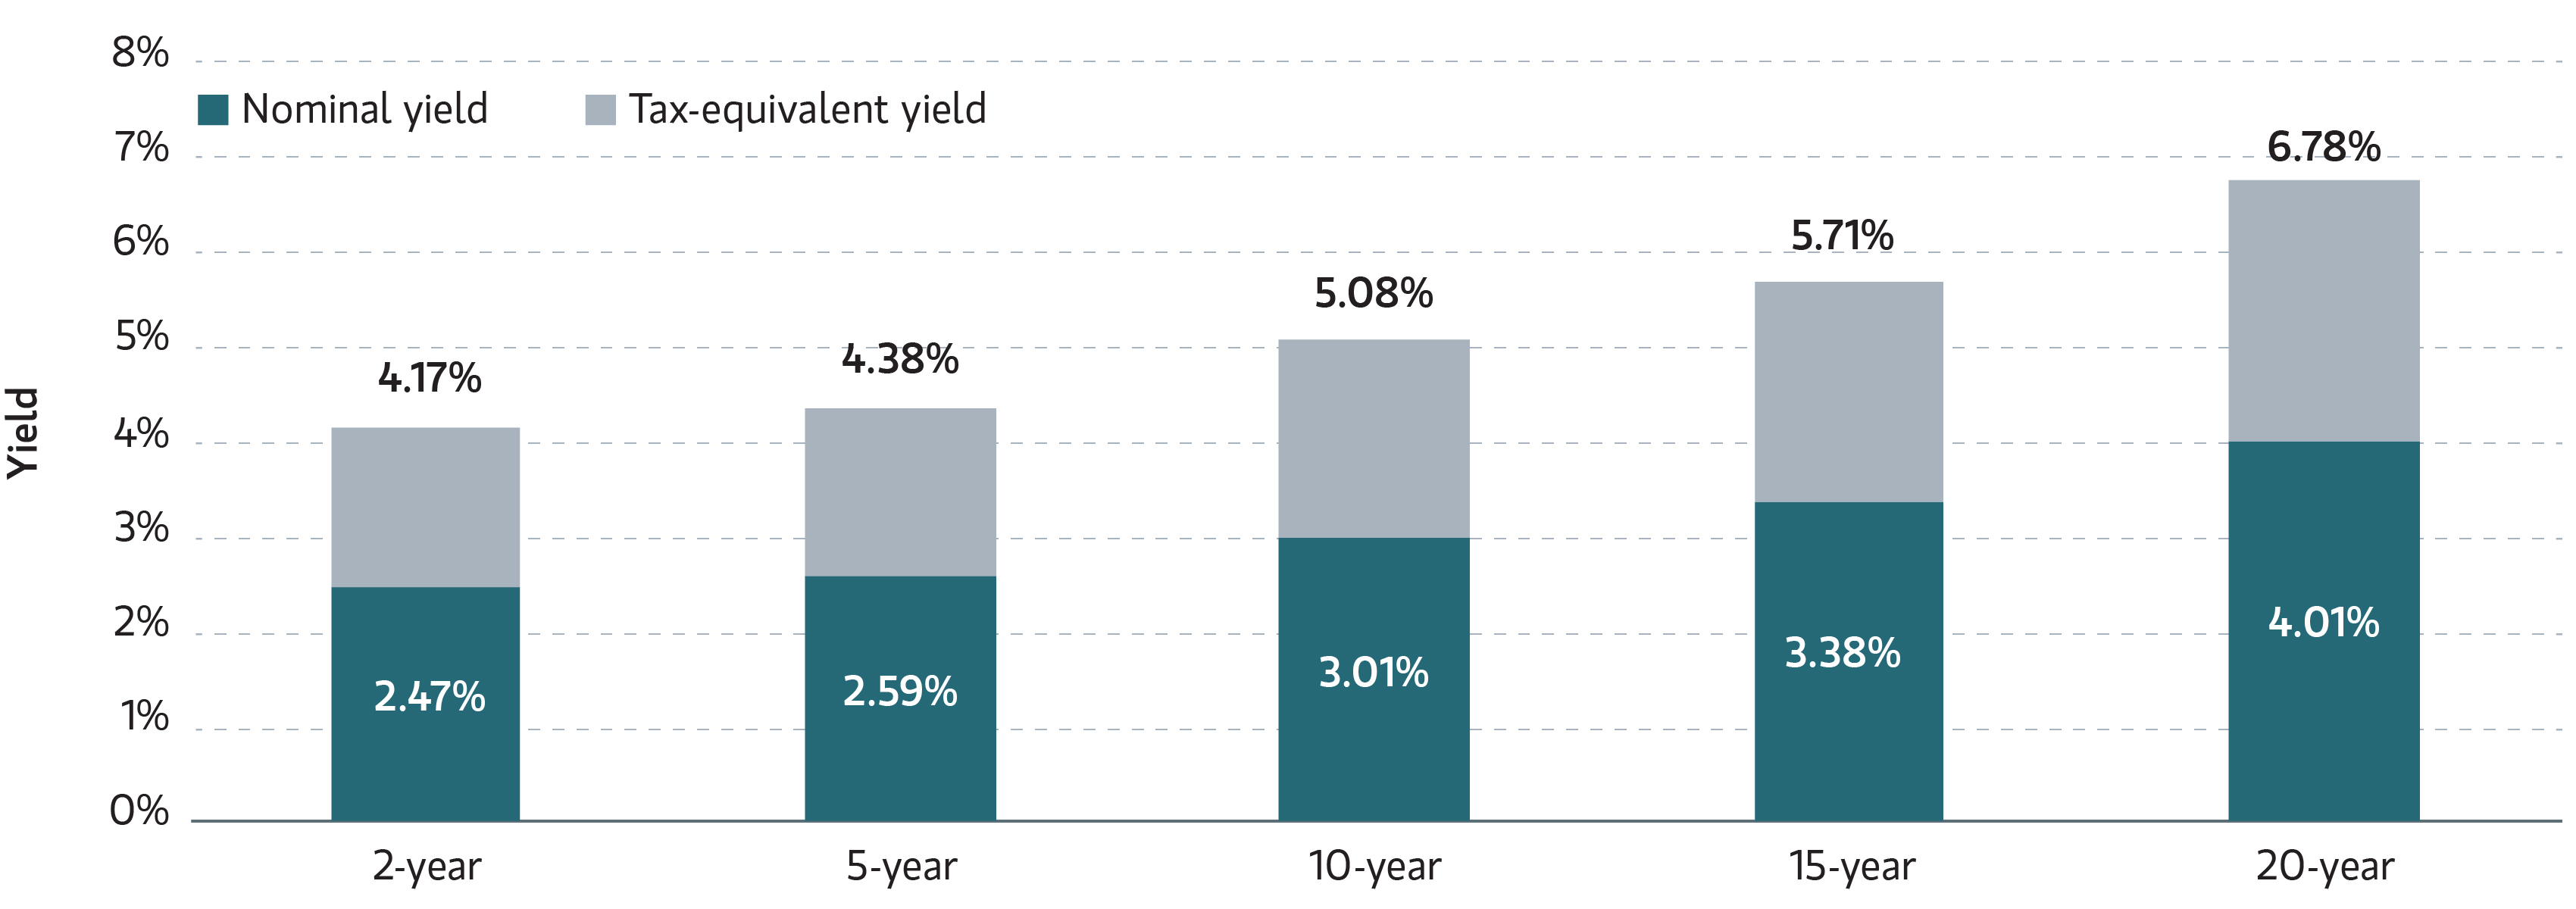
Sources: LSEG, Parametric, 5/29/2026. Assuming a top federal tax rate of 37%, plus 3.8% net investment income tax rate, 40.8% combined. For illustrative purposes only. It is not possible to invest directly in an index. Past performance is no guarantee of future results.
Corporate bond update
The ICE BofA 1-10 Year US Corporate Index returned 0.55% for the week and 0.37% in May. The index outperformed like-duration Treasurys by 0.05% for the week and by 0.37% in May (Bloomberg, 5/29/2026).
US IG corporate yields were lower across the curve last week. Two-, five-, and 10-year yields fell 10, 12 and 12 bps, respectively. Corporate yields are higher YTD, with two-, five- and 10-year yields up 40, 37 and 26 bps, respectively (Bloomberg, 5/29/2026).
IG mutual funds and ETFs experienced inflows of $6.8 billion, a decrease from the previous week’s inflows of $8.9 billion. Corporate-only funds experienced inflows of $1.5 billion, following the previous week’s inflows of $1.3 billion (JPMorgan, 5/29/2026).
Corporate one- to 10-year IG bond yields, which have increased 38 bps YTD, ended last week at 4.9% (Bloomberg, 5/29/2026).
Corporate Index Yield to Worst
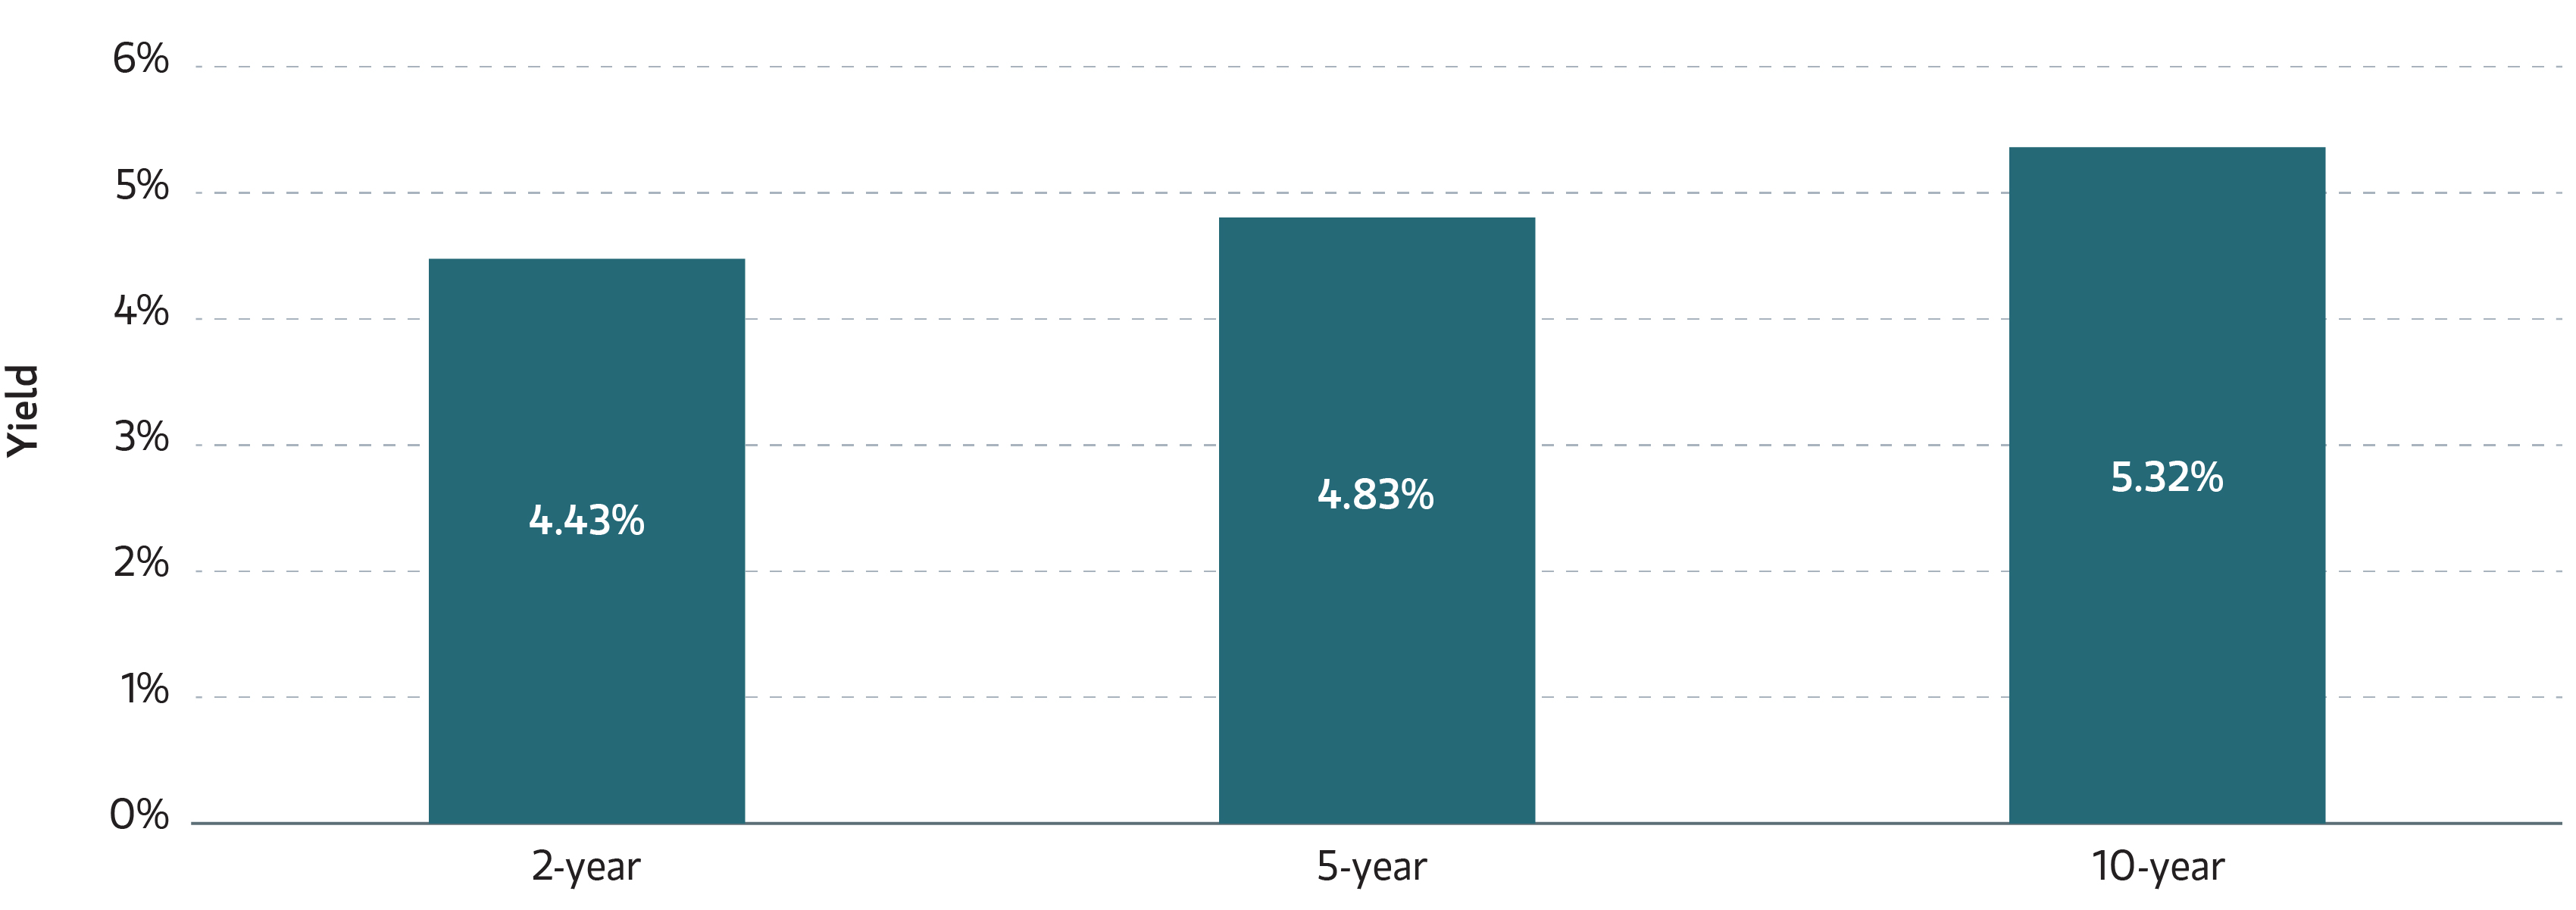
Source: Bloomberg as of 5/29/2026. Past performance is no guarantee of future results. The index performance is provided for illustrative purposes only and is not meant to depict the performance of a specific investment.
Investing in fixed income securities involves risk. All investments are subject to loss. Learn more.
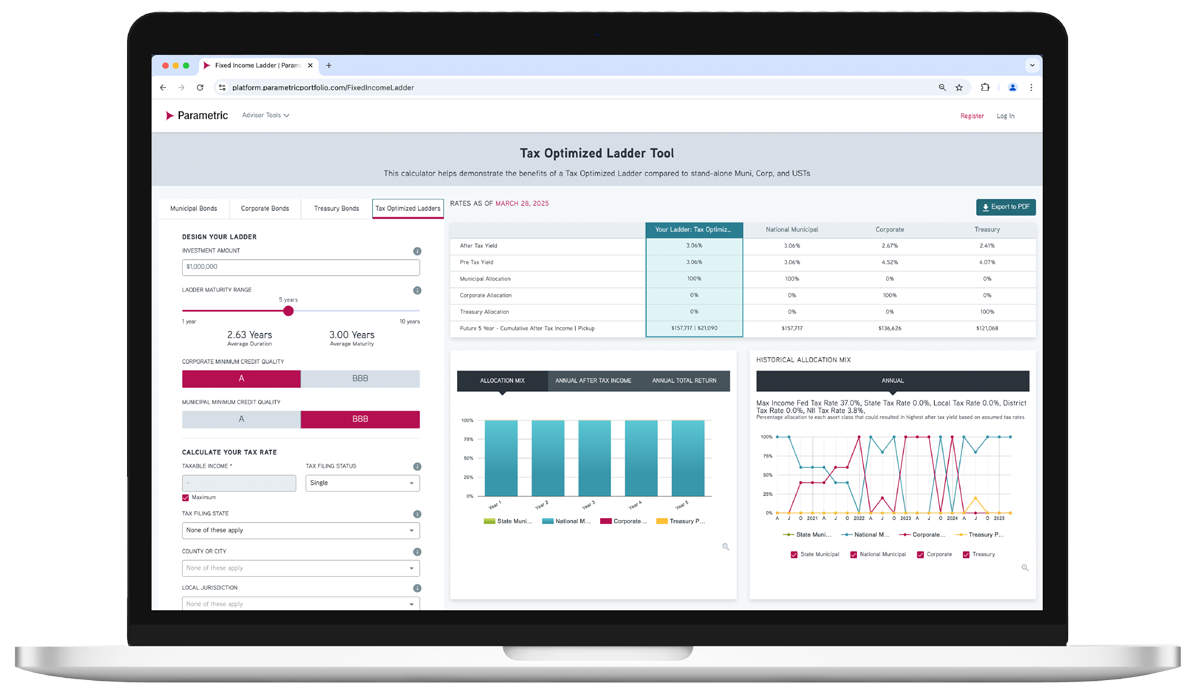
ADVISOR TOOL
Laddered Interest Rate Scenario Tool
Which fixed income asset class is just right for each investor? Explore possible ways to achieve optimal after-tax yield.
Use our online tool to showcase potential benefits of tax-managed and customized laddered bond portfolios.
Featured Content
Corporate Bond Market Insight - The Fed Sees Dissents Amid a Fluctuating Economy
Review the US corporate fixed income market and see what’s ahead for investment-grade and high-yield bonds.
Municipal Bond Market Insight - The Comeback and the Clock
Look back at the month in munis and find out what may be coming for taxable and tax-exempt bonds.
Preferred Securities Market Insight - Rates Rally, Spreads Tighten and Preferreds Rebound
Find out how preferred securities performed this month and where we’re seeing potential for the next month.
Related Content
9/3/2025

8/27/2025

Explore all fixed income solutions
Get in touch
Discover how our fixed income solutions can address today’s challenges. Request a sample portfolio or transition analysis.