

Using a Total Portfolio Approach (TPA) to analyze portfolios holistically and enable more flexible allocations of capital has been a popular topic of conversations with investors. We believe a whole-portfolio perspective is sensible—whether we use TPA, strategic asset allocation or any other approach. That perspective requires more than just gluing together typical equity and fixed income analyses, which is why Parametric introduced the Liquid Factor Model.
TPA implementation challenges lead to innovation
Clients have told us that they don’t see how to implement TPA. They may be concerned about their ability to understand the risks, with some even saying that TPA is aspirational. We understand that. After all, traditional holdings-based factor models (HBFMs) such as Barra typically focus on one asset class: Equity HBFMs lack good measures of yield curve or credit risk, while fixed income HBFMs lack good measures of equity risk.
We can’t expect one of these models to properly implement TPA, and combining these models misses cross-asset risks and correlations. For example, corporate bonds often have some equity beta, which shouldn’t be ignored. REITs and finance stocks are more sensitive to yield curve and credit risks than other stocks in a typical broad market index. Real estate and commodities often have equity and fixed income risks. And all these asset classes may be sensitive to inflation shocks. Gluing equity and fixed income models together ignores all these risks.
We built the Liquid Factor Model to help us capture cross-asset risks and handle multi-asset portfolios. More than aspirational, this model relies on sound theory and is driven by analytic rigor. Investors who use liquid factors may benefit from one consistent view to look at their entire portfolio. We think it’s worthwhile becoming familiar with liquid factors and how they enable a whole-portfolio perspective.
Before we introduce the Liquid Factor Model, let’s take a brief look at some issues associated implementing TPA:
Silos. If investment managers have separate teams analyzing each asset class, this can lead to budgeting capital inefficiently and ignoring the cross-asset risks associated with other asset classes. Liquid factors help to look across the silos to merge the analyses, so managers or the board can see a more complete picture.
Strategic asset allocation (SAA). Many conversations about TPA highlight how SAA can limit portfolios, often proposing instead that investors evaluate the added benefit of each investment—regardless of its asset class. While we don’t consider SAA inherently incompatible with a whole-portfolio approach, we think that shifting from SAA to TPA should begin with a comprehensive view of the entire portfolio to understand the impact and support a discussion about how best to manage the transition.
Private assets. Getting a whole-portfolio perspective can be challenging when private assets like hedge funds, private equity/venture capital, private credit, real estate, infrastructure and commodities are involved. Liquid factors help account for the illiquidity of these assets, improving how we can analyze volatility, Sharpe ratio and exposure changes during liquidity events.
Opportunity costs. Some TPA discussions suggest that SAA may hurt portfolios by excluding esoteric investments. While it’s always possible to miss potential opportunities, selecting approaches that are capable of handling more asset classes and instruments may help to mitigate this risk. Rather than pushing specific investments, we look at the data using a cross-asset model like liquid factors. Since esoteric investments often exhibit lower liquidity, liquid factors may also improve our estimates of how much risk is attributable to illiquidity.
Meet the Liquid Factors
Parametric’s Liquid Factor Model brings equity, yield curve, credit, volatility and inflation risks together—letting investors see that their high-dividend stocks are more exposed to interest rates, corporate bonds have some equity beta and private assets are exposed to credit. The model uses risk factors backed by liquid instruments that can be easily and cheaply traded—requiring little additional capital and without altering the portfolio. This makes the factors actionable: Hedging or extending an exposure is as easy as trading the instruments used to define the factors.
Such intuition and simplicity comes from looking at factors well-supported by data across economies and macroeconomic regimes, using machine learning techniques to assess risk while accounting for correlations between markets and interpreting the model to find key factors and reduce complexity. The result is a model intentionally designed to be more stable while highlighting the subset of factors for which we have conviction. In our experience, investors generally prefer to understand and focus on more dependable exposures, rather than swimming in a sea of numbers with little to indicate which are just noise.
We’ve identified 10 liquid factors in an economy, with the full set of liquid factors specified for many developed economies and the potential to add some factors for other economies like emerging markets. We are also transparent about the factor definitions:
Liquid Factor Definitions
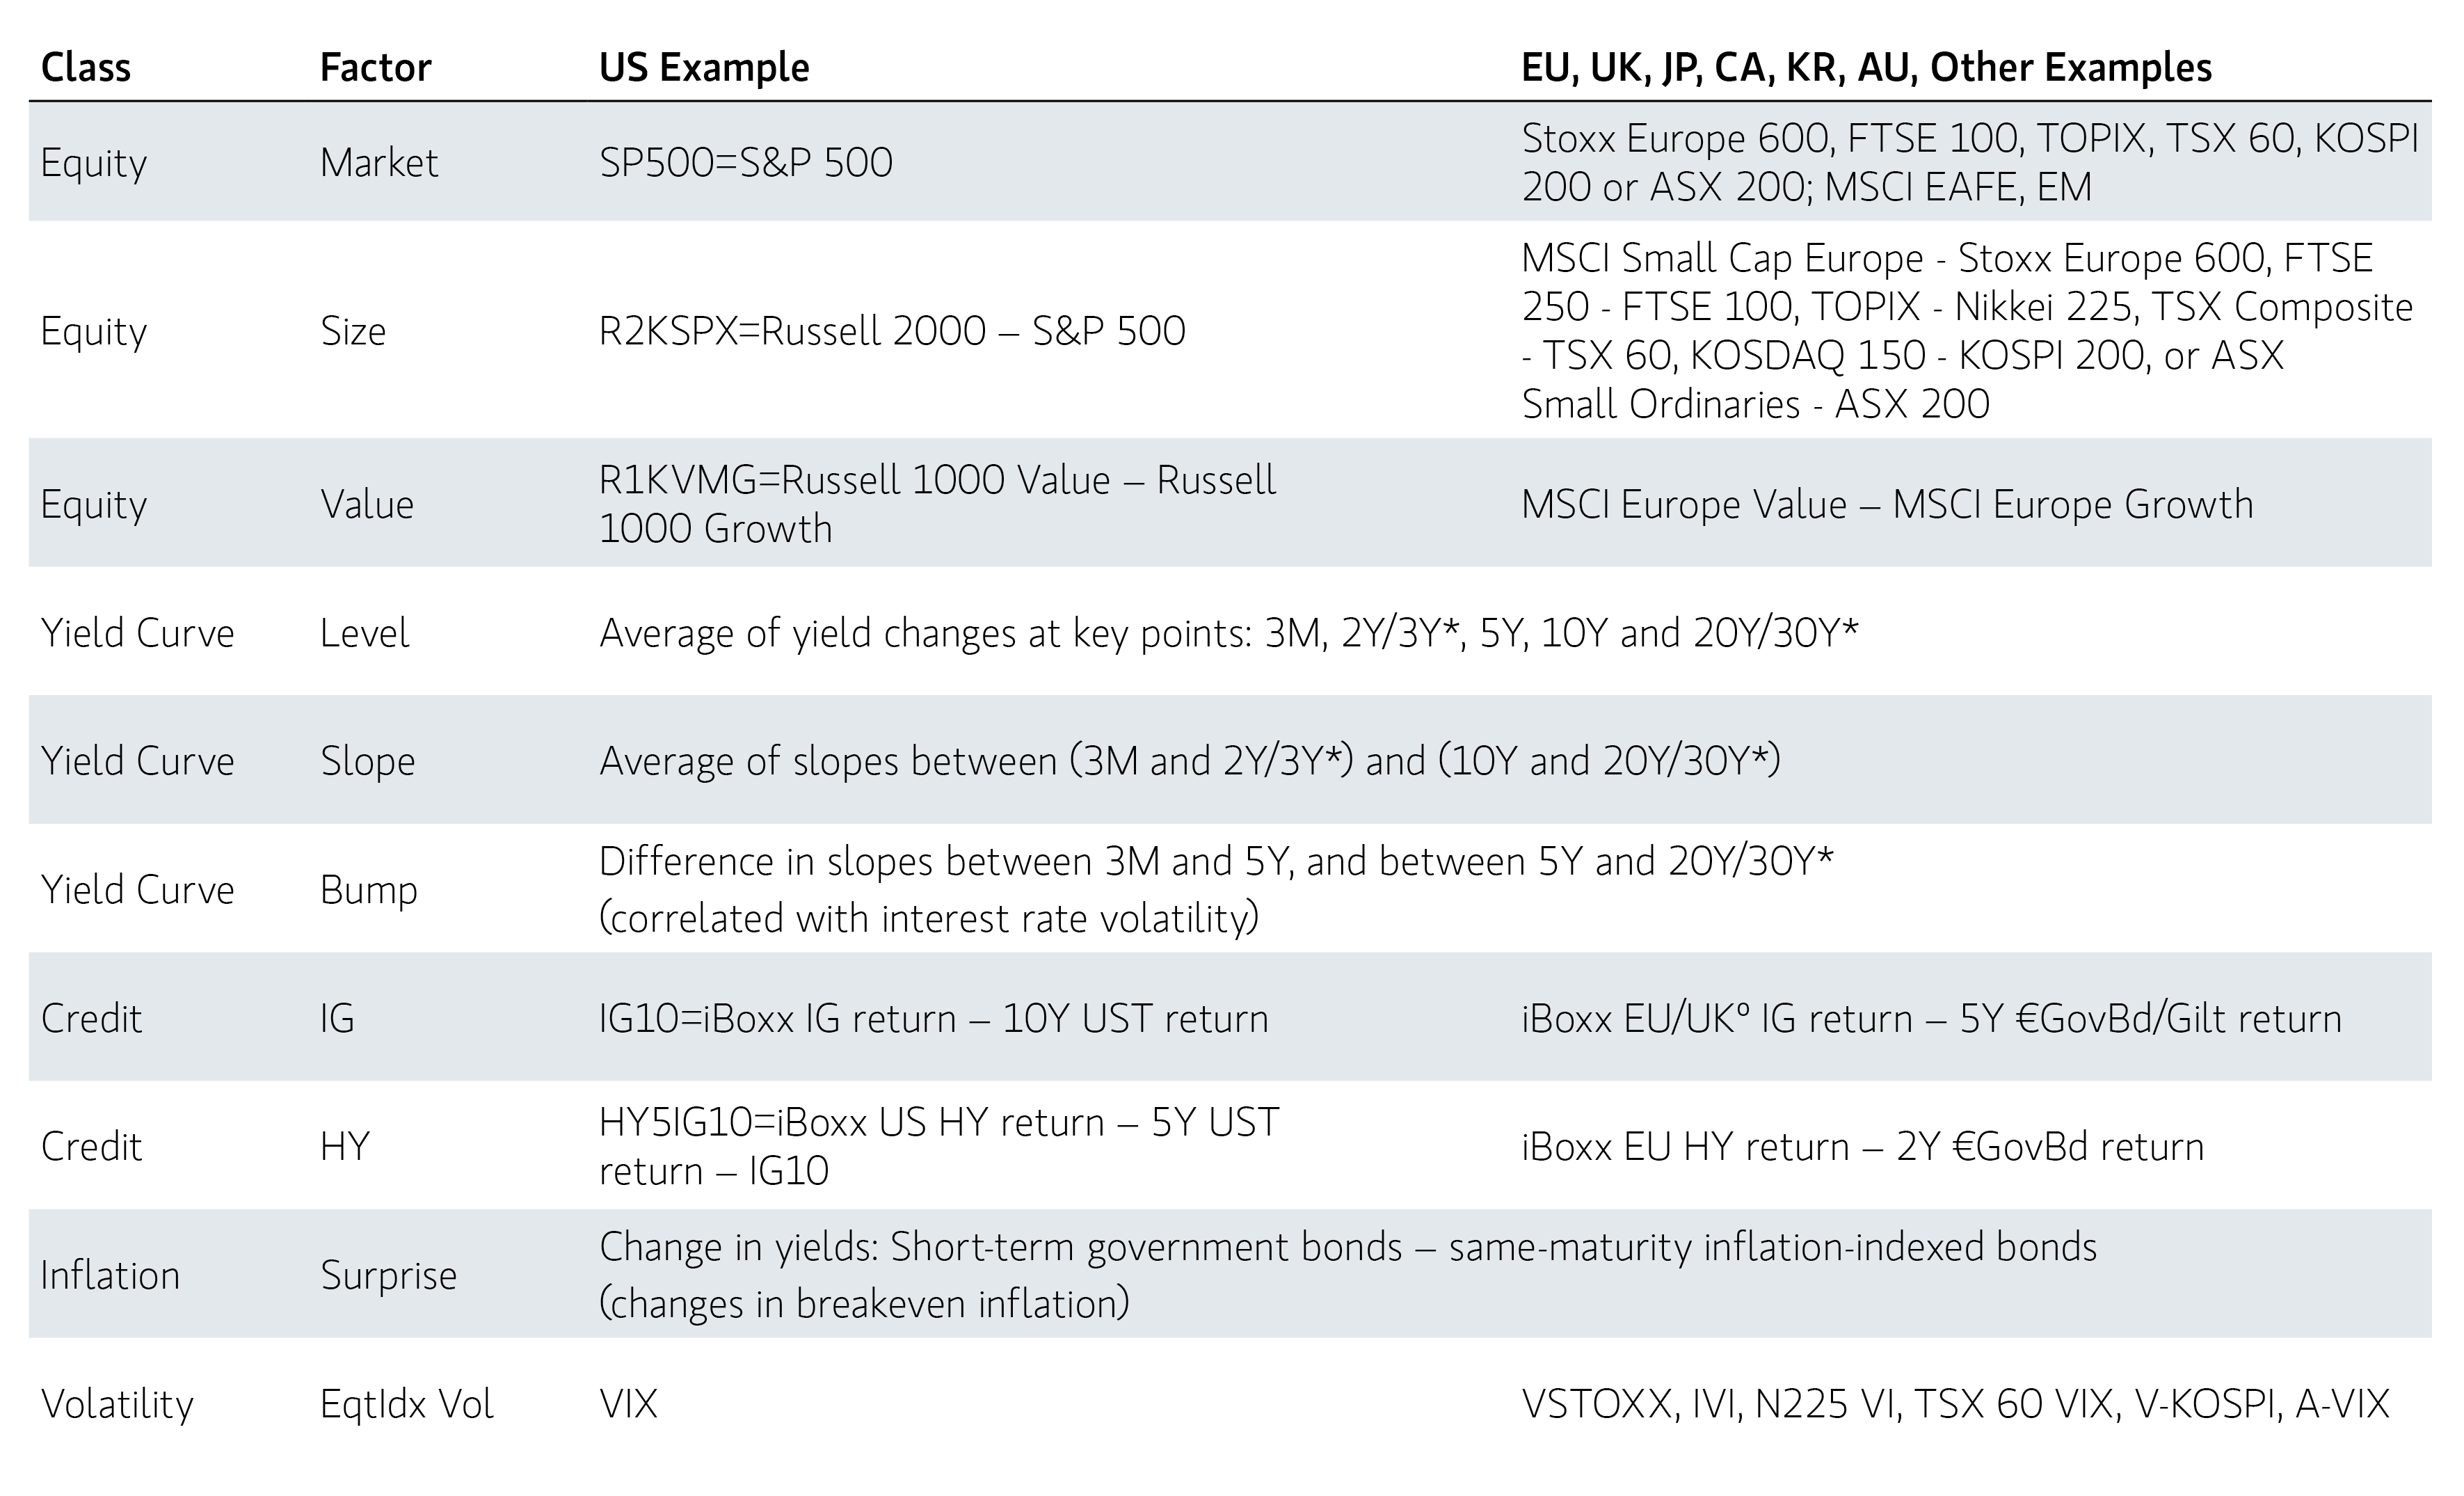
* In Korea and Australia, the 3Y point is preferred to the 2Y.
° In the UK, the closest to an investment grade (IG) index is the liquid corporates index.
For some simple intuition about how the model works, let’s say an investor is wondering how the equity size factor is doing. If the Russell 2000 Index is up 1.4% and the S&P 500 Index is up 0.6%, then size is up 1.4% – 0.6% = 80 basis points (bps). Why make things hard?
As an example of implementing the full model, consider the analysis of a sophisticated multi-asset US investment fund using monthly data from 2015 to 2024Q1. While we often look at benchmark-relative performance to find sources of tracking error, here we look at total risk. In general, we find that the estimated exposure or beta of a factor is likely to be significant if the t-statistic is greater than 2:
Liquid Factor Exposures Example
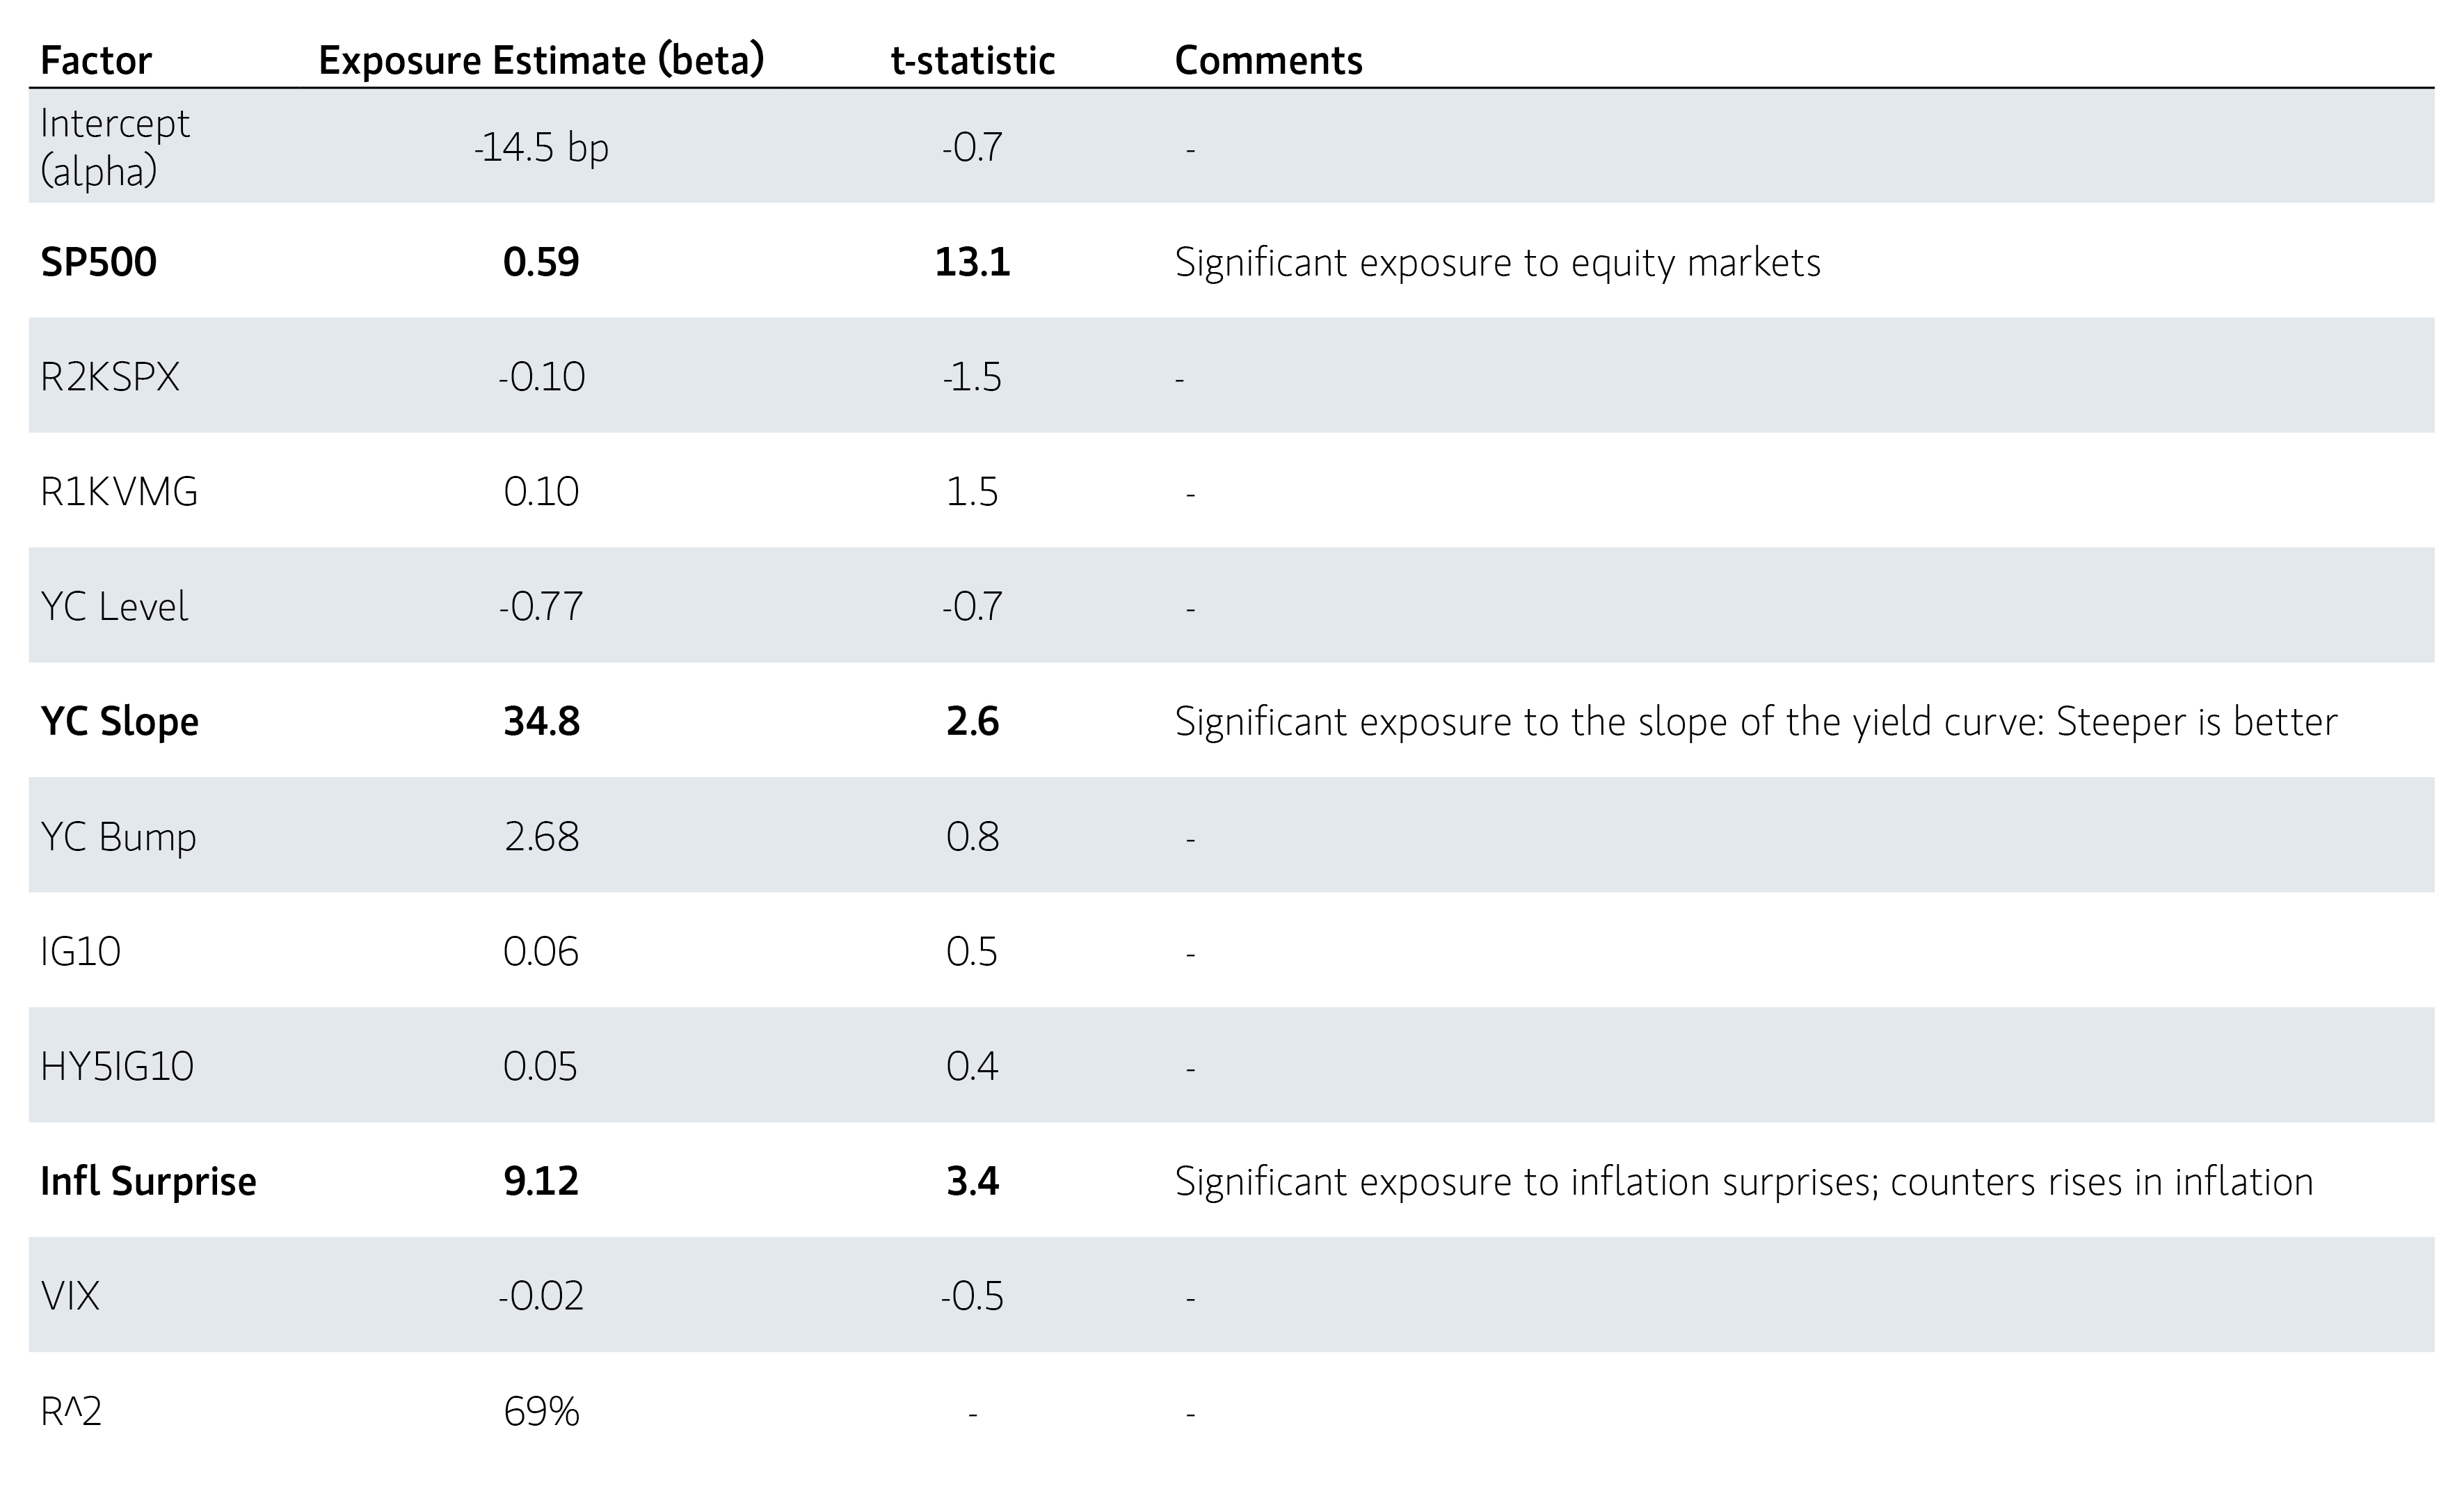
Source: Parametric, data as of 03/31/2024, t-statistic measures the difference between a sample mean and a hypothesized population mean, scaled by the sample's standard error. For illustrative purposes only. Not a recommendation to buy or sell any security. It should not be assumed that any of the securities listed were or will be profitable. Actual portfolio holdings will vary for each client’s account and there is no guarantee that a particular client’s account will hold any, or all, of the securities identified. It is not possible to invest directly in an index. Indexes are unmanaged and do not reflect the deduction of fees and expenses. All investments are subject to risk, including risk of loss.
The Liquid Factor Model suggests that this portfolio is significantly exposed to US equity markets (with a beta of about 0.6), the slope of the US yield curve (doing better when the curve steepens) and shocks to breakeven inflation (offering some defensiveness to rises in inflation). But we can’t conclude that this fund has significant alpha, so let’s hope investors aren’t paying high fees.
Take more control through Cross-Asset Portfolio Solutions
Reducing complexity, increasing transparency. While we use 10 factors, only three are significant (t-stats > 2 in magnitude) in affecting returns. That reduces the complexity of understanding the portfolio to only three factors. Compare this to many factor models that don’t indicate which factors are statistically significant. And because we made the risk factors transparent, we can look them up on our phones. With the betas, an investor can estimate how their portfolio is doing—even on the way to a meeting.
Get the whole-portfolio perspective with Liquid Factors
If investors are looking to move to TPA, they need a model that can give a whole-portfolio perspective. Most models can’t do that, which is why we developed the Liquid Factor Model. Liquid factors allow investors to analyze their entire portfolio—including opaque investments and esoteric instruments—while helping to reduce complexity and use transparent risk factors that are inexpensive to hedge.
Whether an investor is considering TPA or wants to stick with SAA or another approach, they may benefit from seeing what a whole-portfolio perspective looks like. Liquid factors can help reveal what risks may have been missed and what changing the approach might entail. However a board chooses to guide their managers, Parametric has the knowledge to help and the ability to turn ideas into action.
Further reading
Rosenthal, Dale W.R. “Liquid Factor Models,” SSRN Working Paper 4825468, FEB-RN Research Paper No. 135/2025, May 9, 2024.
Rosenthal, Dale. “Introducing Liquid Factors: A Cleaner look at Risk,” Parametric white paper, 2025.
The views expressed in these posts are those of the authors and are current only through the date stated. These views are subject to change at any time based upon market or other conditions, and Parametric and its affiliates disclaim any responsibility to update such views. These views may not be relied upon as investment advice and, because investment decisions for Parametric are based on many factors, may not be relied upon as an indication of trading intent on behalf of any Parametric strategy. The discussion herein is general in nature and is provided for informational purposes only. There is no guarantee as to its accuracy or completeness. Past performance is no guarantee of future results. All investments are subject to the risk of loss. Prospective investors should consult with a tax or legal advisor before making any investment decision. Please refer to the Disclosure page on our website for important information about investments and risks.
05.07.2028 | RO 5459506