
Weekly Fixed Income Insights
Track what matters in fixed income: Macro news, policy moves and developments in the municipal and corporate markets.
FOMC recap: hawkish vote, dovish reaction
July 30, 2026
Fixed income portfolio manager Kevin Lynyak on hawkish vote, and dovish reaction. Listen now:
Here we go again on tariffs: What Section 301 & 338 tariffs mean for markets
July 30, 2026
Fixed income portfolio manager Kevin Lynyak talks about tariffs . Listen now:
July 28, 2026
Macro update
Higher oil prices pushed Treasury yields to fresh highs last week as the conflict expanded to key shipping routes. Brent crude rose nearly 10% and briefly traded above $100, while the 10-year Treasury yield increased 13 bps to 4.68%, its highest close since January 2025. The move reflected both a higher real cost of capital and renewed inflation concerns (Bloomberg, 7/24/2026).
Technology-led equities lower as investors reassessed the cost and prospective returns of the AI investment cycle. The Nasdaq declined 2.1%, compared with losses of 0.6% for the S&P 500®, 0.4% for the Dow and 1.1% for the Russell 2000 (Bloomberg, 7/24/2026).
Credit spreads widened as rates moved higher and risk sentiment weakened. Higher all-in yields continued to attract buyers, but long-duration credit and technology materially underperformed (Bloomberg, 7/24/2026).
Tariff policy shifted, but the effective rate changed little. This week’s measures largely replaced expiring temporary tariffs, leaving the effective tariff rate near 10%. The proposed 50% Canadian tariffs are more headline-grabbing than macroeconomically consequential, although they pose targeted risks to plastics, lumber and housing (Bloomberg, 7/24/2026).
Looking ahead, investor attention shifts to this week’s Federal Open Market Committee (FOMC) meeting, second-quarter GDP, core PCE and the employment cost index. Markets are pricing a 33% chance of a hike, though our base case is a hold with hawkish messaging, as higher oil prices and tighter financial conditions do some of the Fed’s work. Earnings from Microsoft, Meta, Apple and Amazon will also keep AI capital spending, cash conversion and financing plans at the center of the market debate (Bloomberg, 7/24/2026).
Municipal bond update
AAA municipal yields moved sharply higher across the curve last week. Two- and five-year yields rose 18 and 19 basis points (bps), respectively, while 10- and 30-year yields increased 22 and 19 bps, respectively. This price action left these benchmarks at 2.61%, 2.92%, 3.36% and 4.52%, respectively (LSEG, 7/24/2026).
Five- to 20-year A-rated muni yields closed last week ranging from 3.10% to 4.45%, with related taxable-equivalent yields ranging from 5.24% to 7.52%, assuming a combined federal tax rate of 40.8% (Parametric, LSEG, 7/24/2026).
Muni mutual fund flows slowed sharply, with a modest $174 million of inflows as of July 22. ETFs attracted $214 million, while open-end funds experienced $40 million of outflows (LSEG, JPMorgan, 7/24/2026).
This week's calendar eases to $7.7 billion scheduled to enter the primary market, with the lighter docket typical during an FOMC week (Ipreo, 7/24/2026).
Fixed income finished a very challenging week, leaving the Bloomberg Municipal Bond Index returning just 0.30% year to date, while the Bloomberg US Treasury Index moved further into negative territory with a -0.73% year-to-date return (Bloomberg, 7/24/2026).
Municipal Index Yield to Worst
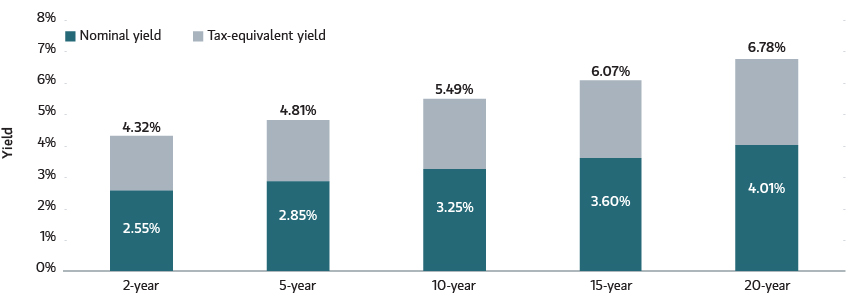
Sources: LSEG, Parametric, 7/28/2026. Assuming a top federal tax rate of 37%, plus 3.8% net investment income tax rate, 40.8% combined. For illustrative purposes only. It is not possible to invest directly in an index. Past performance is no guarantee of future results.
Corporate bond update
The ICE BofA 1-10 Year US Corporate Index returned -0.54% for the week and -0.72% month to date. The index underperformed like-duration Treasurys by -0.04% for the week and by -0.11% month to date (Bloomberg, 7/24/2026).
U.S. investment-grade (IG) corporate yields rose across the curve last week. Two-, five- and 10-year yields increased 14, 16 and 16 bps, respectively. Corporate yields are higher year to date (YTD), with two-, five- and 10-year yields up 72, 69 and 57 bps, respectively (Bloomberg, 7/24/2026).
IG mutual funds and ETFs experienced inflows of $5.2 billion, a decrease from the previous week’s inflows of $6.5 billion. Corporate-only funds experienced inflows of $948 million, following the previous week’s inflows of $2.5 billion (JPMorgan, 7/24/2026).
Corporate one- to 10-year IG bond yields, which have increased 69 bps YTD, ended last week at 5.2% (Bloomberg, 7/24/2026).
Corporate Index Yield to Worst
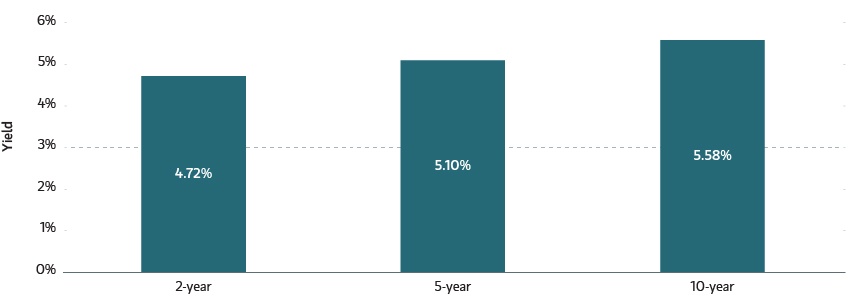
Source: Bloomberg as of 7/28/2026. Past performance is no guarantee of future results. The index performance is provided for illustrative purposes only and is not meant to depict the performance of a specific investment.
Investing in fixed income securities involves risk. All investments are subject to loss. Learn more.
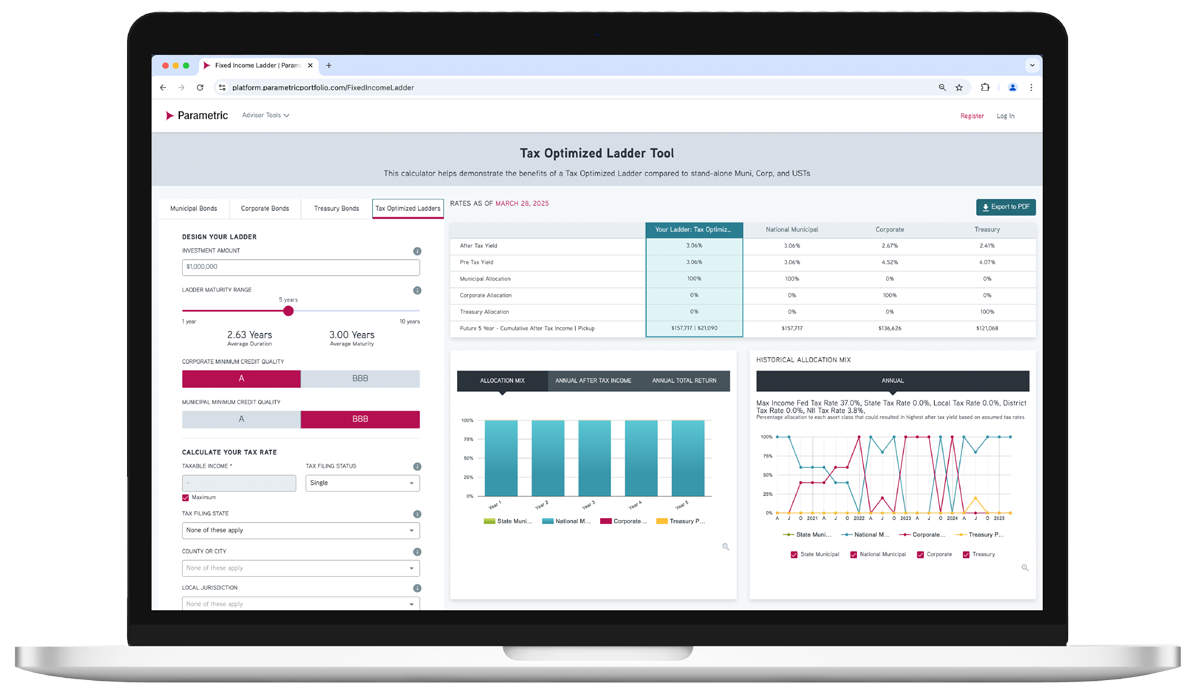
ADVISOR TOOL
Laddered Interest Rate Scenario Tool
Which fixed income asset class is just right for each investor? Explore possible ways to achieve optimal after-tax yield.
Use our online tool to showcase potential benefits of tax-managed and customized laddered bond portfolios.
Featured Content
Corporate Bond Market Insight - Resilient Growth Meets Rising Inflation
Review the US corporate fixed income market and see what’s ahead for investment-grade and high-yield bonds.
Municipal Bond Market Insight - Capture the Curve
Look back at the month in munis and find out what may be coming for taxable and tax-exempt bonds.
Preferred Securities Market Insight - Fundamentals Remain Strong, but Listed Preferreds Face Technical Headwinds
Find out how preferred securities performed this month and where we’re seeing potential for the next month.
Related Content
6/11/2026

5/18/2026
Explore all fixed income solutions
Get in touch
Discover how our fixed income solutions can address today’s challenges. Request a sample portfolio or transition analysis.