

Weekly Fixed Income Insights
Track what matters in fixed income: Macro news, policy moves and developments in the municipal and corporate markets.
Rising Bond Yields Are Not Just a US Problem
October 13, 2026
Fixed income portfolio manager Kevin Lynyak talks about global bond yields. Listen now:
The 10-Year Isn't Broken. It's Being Repriced
September 28, 2026
Fixed income portfolio manager Kevin Lynyak talks about how to actually value the 10-Year Treasury. Listen now:
October 20, 2026
Macro update
Treasury yields moved sharply lower last week as concerns around AI-related equity and credit markets overshadowed stronger-than-expected inflation data. September core Consumer Price Index increased approximately 0.3% month over month and 2.6% year over year, while the Producer Price Index was also firm. Despite the inflation data, the 10-year Treasury yield declined roughly 17 basis points (bps) to 5.07%, while the 30-year fell approximately 18 bps, as investors sought the safety of duration (Bloomberg, 10/16/2026)
AI-related risk aversion broadened from equities into credit markets. The Nasdaq declined 4.5%, and semiconductors fell more than 11%, while spreads on high-yield neocloud debt widened as investors reassessed the financing model supporting AI-related investment. The weakness highlighted growing concerns around capital intensity and the sustainability of debt-financed growth (Bloomberg, 10/16/2026).
The flight to quality reduced expectations for additional near-term Federal Reserve tightening. Chair Warsh's comments reinforced the Fed's reluctance to raise rates in October, with market-implied odds of a hike declining to approximately 15% by Friday. Despite persistent inflation, tighter financial conditions driven by equity and credit weakness reduced pressure for another policy adjustment (Bloomberg, 10/16/2026).
Bank earnings remained generally resilient despite broader market volatility. Third-quarter results reflected improving net interest income outlooks and strong equity trading, which offset weaker fixed-income trading activity. Consumer credit remained relatively stable, although lower capital ratios and isolated wholesale and commercial real estate stress highlighted the continued impact of elevated rates on bank balance sheets.
Looking ahead, inflation remains elevated, but the direction of Treasury yields may increasingly depend on developments in the AI investment and financing cycle. Last week's rally demonstrated that duration retains its defensive characteristics when growth and credit concerns intensify, even as underlying inflation pressures remain persistent.
Municipal bond update
AAA municipal yields moved sharply lower across the curve last week. Two- and five-year yields declined 23 bps each, while 10- and 30-year yields fell 23 and 17 bps, respectively. This sizable price action left these benchmarks at 3.07%, 3.30%, 3.75% and 4.95%, respectively (LSEG, 10/16/26).
Five- to 20-year A-rated muni yields closed last week ranging from 3.48% to 5.00%, with related taxable-equivalent yields ranging from 5.88% to 8.45%, assuming a combined federal tax rate of 40.8% (LSEG, Parametric, 10/16/2026).
Muni mutual funds saw net inflows of $1.6 billion, with the mix suggesting continued tax-loss harvesting activity, as open-end funds surrendered $3.4 billion and ETFs received $5 billion (LSEG, JP Morgan, 10/14/2026).
This week's calendar is on trend, with more than $12.7 billion scheduled to enter the primary market (Ipreo, 10/16/2026).
Munis outperformed last week, improving their year-to-date (YTD) return to -2.24%, while the Bloomberg US Treasury Index also had a positive week, improving its YTD return to -1.54% (Bloomberg, 10/16/2026).
Municipal Index Yield to Worst

Sources: LSEG, Parametric, 10/16/2026. Assuming a top federal tax rate of 37%, plus 3.8% net investment income tax rate, 40.8% combined. For illustrative purposes only. It is not possible to invest directly in an index. Past performance is no guarantee of future results.
Corporate bond update
The ICE BofA 1-10 Year US Corporate Index returned 0.52% for the week and 0.92% month to date (MTD). The index underperformed like-duration Treasurys by -0.1% for the week and remains flat MTD. With interest rates falling and credit spreads modestly wider, the index produced a positive total and excess return. YTD returns stand at -0.48% (Bloomberg, 10/16/2026).
U.S. investment-grade (IG) corporate yields decreased across the curve last week. Two-, five- and 10-year yields decreased seven, 13 and 14 bps, respectively. Corporate yields are higher YTD, with two-, five- and 10-year yields up 121, 120 and 92 bps, respectively. Corporate one- to 10-year IG bond yields, which have increased 117 bps YTD, ended last week at 5.65%. This was the second consecutive week that yields declined week over week (Bloomberg, 10/16/2026).
IG mutual funds and ETFs experienced inflows of $1.94 billion, a decrease from the prior week’s inflows of $10.8 billion. Corporate-only funds recorded inflows of $1.89 billion following last week’s inflows of $4.5 billion. Overall inflows were below the four-week average of $5.5 billion, with the reporting week shortened by the Columbus Day bond market holiday. ETF inflows of $6.7 billion were partially offset by mutual fund outflows of $4.8 billion (JPMorgan, 10/16/2026).
Corporate Index Yield to Worst

Source: Bloomberg, 10/16/2026. Past performance is no guarantee of future results. The index performance is provided for illustrative purposes only and is not meant to depict the performance of a specific investment.
Investing in fixed income securities involves risk. All investments are subject to loss. Learn more.
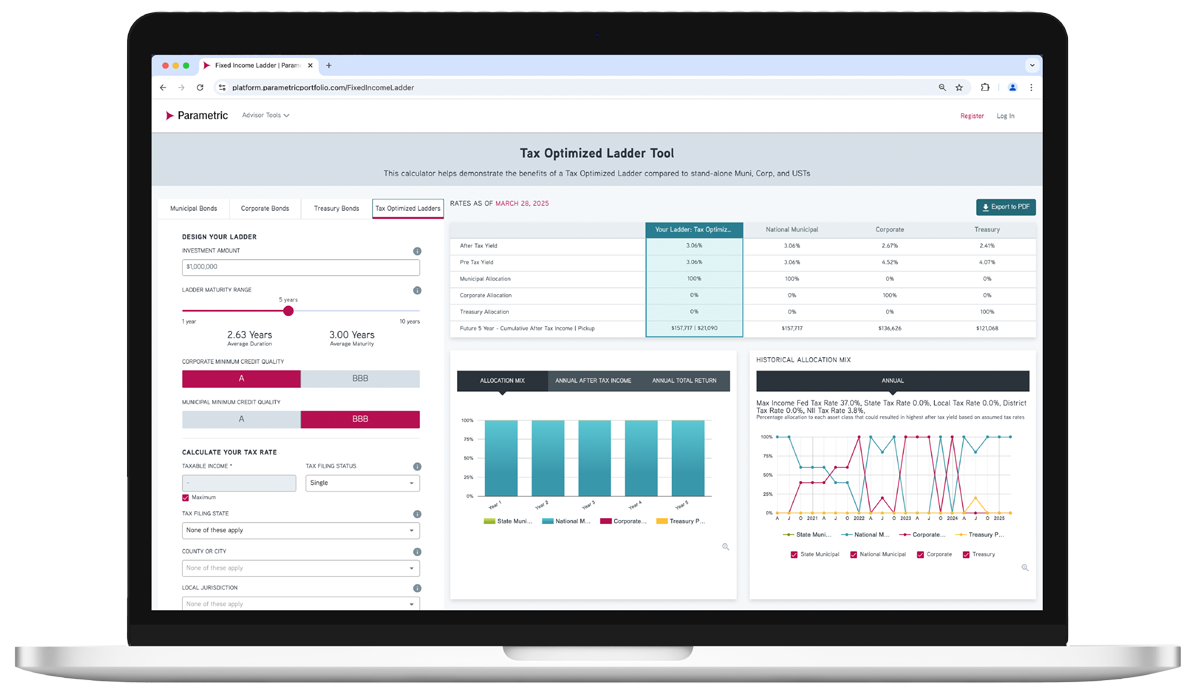
ADVISOR TOOL
Laddered Interest Rate Scenario Tool
Which fixed income asset class is just right for each investor? Explore possible ways to achieve optimal after-tax yield.
Use our online tool to showcase potential benefits of tax-managed and customized laddered bond portfolios.
Featured Content

Corporate Bond Market Insight - Rising Rates, Resilient Corporate Bond Ladders
Review the US corporate fixed income market and see what’s ahead for investment-grade and high-yield bonds.
Municipal Bond Market Insight - The Long View
Look back at the month in munis and find out what may be coming for taxable and tax-exempt bonds.
Preferred Securities Market Insight - Preferred Coupons Stay Healthy as Back Ends Slim Down
Find out how preferred securities performed this month and where we’re seeing potential for the next month.
Related Content
6/11/2026

5/18/2026
Explore all fixed income solutions
Get in touch
Discover how our fixed income solutions can address today’s challenges. Request a sample portfolio or transition analysis.