

In fixed income investing, trade execution plays an important role in overall portfolio performance. The ability to source bonds efficiently, invest capital thoughtfully and execute trades at competitive prices can directly affect investor returns.
In 2025, our trading desk executed more than $68 billion across municipal and taxable markets, averaging over $220 million per trading day and more than 834,000 individual trades. This level of activity reflects both the breadth of our SMA platform and the experience required to consistently trade across thousands of customized portfolios.

Scale as a structural advantage
Consistent participation in fixed income markets can provide meaningful advantages.
Operating at scale can help to strengthen dealer relationships, improve access to liquidity and enhance pricing outcomes. In segments of the market where liquidity can be weaker—particularly smaller municipal bond lot sizes—reliable trading activity often encourages dealers to commit capital more competitively.
Scale also generates insight. Each trade contributes to a growing body of pricing and liquidity data that informs future execution decisions across portfolios.
Electronic trading platforms have made corporate bond executions nearly seamless, while also providing massive amounts of transaction data. The InterContinental Exchange (ICE) is an index provider and pricing service that acts as a data consolidator, combining information from several platforms and the Trade Reporting and Compliance Engine (TRACE). This data is used to estimate index-level transaction costs and specific issue-by-issue liquidity.
Transaction costs for investment-grade corporate bonds have declined sharply—despite the immense growth in outstanding debt. ICE estimates that index-level round-trip transaction costs have fallen from 45 basis points (0.45%) in July 2022 to only 16 bps (0.16%). It’s notable that the bid-offer spread in many liquid IG corporate issues has been almost entirely eliminated.
Importantly, our electronic trading generates a wide range of discrete execution data, which can be quantitatively parsed to define the liquidity characteristics of issues that are most likely to lead to better trade execution.
In 2025, our fixed income trading activity represented roughly 5% of all customer-to-dealer municipal bond transactions and 2.5% of all customer-to-dealer investment-grade corporate bond trades. That reflects our consistent presence across both markets.
Actively manage fixed income securities to turn inefficiency into opportunity
Balancing speed and patience in portfolio construction
Investing capital efficiently helps reduce cash drag and allows portfolios to begin generating income sooner. At the same time, trading too quickly can increase transaction costs. Our process is designed to balance both considerations.
Technology plays an important role in this process. Our internal systems generate buy and sell orders and allocate trades across thousands of accounts each day. This allows our traders to focus more on evaluating market conditions and the execution quality of each trade—and less on operational or allocation issues.
In 2025, portfolios were typically invested quickly while still allowing flexibility for market conditions. On average, across all municipal SMA mandates, accounts reached 50% investment levels in roughly five days and over 95% investment levels within two weeks. Investment-grade corporate ladder portfolios were fully invested on average within two days of the account being opened. Higher liquidity also allows for quicker and less expensive portfolio adjustments as an individual’s investment objectives change.
Importantly, these timelines reflect deliberate portfolio construction rather than speed alone. Market conditions often influence investment pacing.
For example, municipal bond issuance reached a record $570 billion in 2025, with new issue supply arriving unevenly week to week. Some weeks brought only a few billion dollars in deals, while others exceeded $20 billion. Because the majority of new issues typically price only a few days each week, investors must balance opportunities in the primary market with activity in the secondary market.
Last year, 58% of our municipal purchases occurred in the primary market, where attractive pricing opportunities were frequently available, with the remaining 42% sourced in the secondary market.
Purchases on the Parametric municipal desk in 2025

Source: Parametric, as of 12/31/2025. For illustrative purposes only. Not a recommendation to buy or sell any security.
Evaluating execution quality
Execution quality can be measured objectively. The Municipal Securities Rulemaking Board (MSRB) provides public transaction data through its EMMA® platform, offering transparency into municipal bond pricing across the market. This information provides a useful benchmark when evaluating trading outcomes.
One common measure compares the price at which a bond is sold to an independent evaluation price. For example, if a bond evaluated at $1,000 is sold at $999, the execution spread is $1, or 0.10%. Larger trades typically experience tighter spreads due to improved liquidity.
Using this framework, we compared our secondary market bond sales during 2025 with the broader municipal market.
Secondary market sales in 2025: Spread to evaluated price (as % of par)
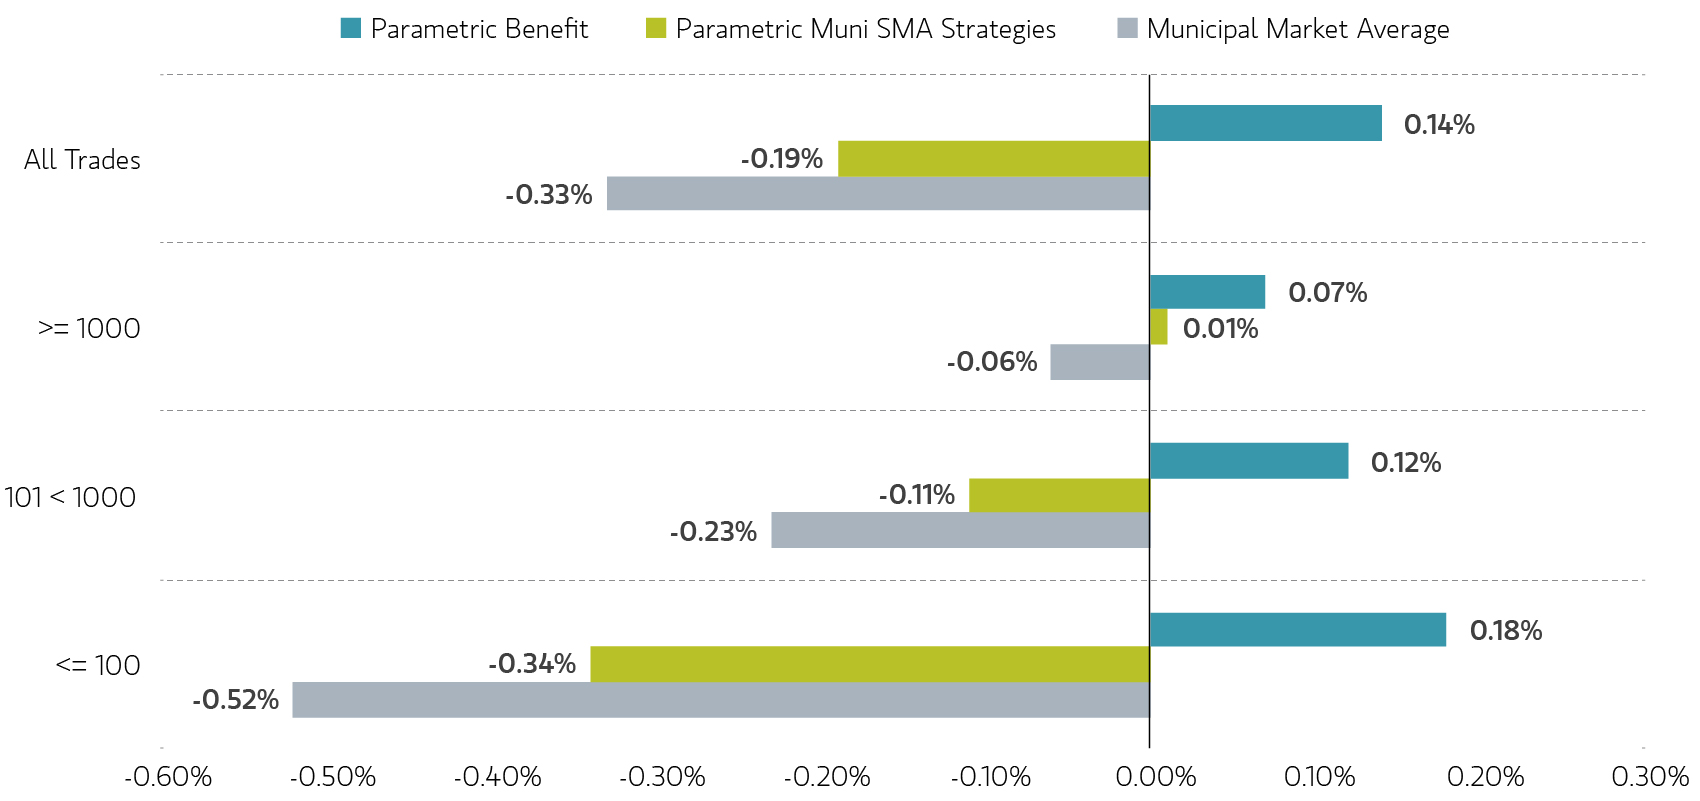
Source: Parametric, MSRB as of 12/31/2025. For illustrative purposes only. Not a recommendation to buy or sell any security.
Across all trade sizes, our execution averaged 0.15% closer to evaluation pricing than the market average. Applied to $14.7 billion of client bond sales during the year, that difference represents more than $22 million in estimated transaction cost savings for investors.
Importantly, the results were consistent across trade sizes—from smaller retail-sized lots to larger institutional trades.
The same type of analysis can be applied to our trading of investment-grade corporate bonds. By comparing ICE transaction cost data with our own trading data, we can evaluate the quality of our execution versus the average execution. Our trade-level transaction costs are significantly lower at 11 bps (0.11%) versus the average cost of 16 bps (0.16%) for the ICE BofA US Corporate Index. We can attribute this reduction in trading cost to our experienced trading team and our quantitative research, which allow us to identify the most liquid bonds with the lowest transaction costs.
The bottom line
Trading fixed income portfolios requires balancing many considerations: liquidity, market timing, portfolio construction and transaction costs.
Scale can improve market access. Technology can streamline execution workflows. Research can ensure that trades are being made in the most liquid issues. And experienced traders can evaluate when speed or patience is most appropriate.
In 2025, this combination led to faster capital deployment, consistent transaction cost savings and institutional-quality execution delivered across thousands of separately managed accounts.
The views expressed in these posts are those of the authors and are current only through the date stated. These views are subject to change at any time based upon market or other conditions, and Parametric and its affiliates disclaim any responsibility to update such views. These views may not be relied upon as investment advice and, because investment decisions for Parametric are based on many factors, may not be relied upon as an indication of trading intent on behalf of any Parametric strategy. The discussion herein is general in nature and is provided for informational purposes only. There is no guarantee as to its accuracy or completeness. Past performance is no guarantee of future results. All investments are subject to the risk of loss. Prospective investors should consult with a tax or legal advisor before making any investment decision. Please refer to the Disclosure page on our website for important information about investments and risks.
05.14.2028 | RO 5475010