


Parametric offers access to many equity indexes as benchmarks for direct indexing separate accounts. Let’s look at the reasons why an investor might choose an index other than the S&P 500.
The popularity of direct indexing has grown significantly since the pandemic, with no signs of easing.1 At Parametric, we’ve observed that a lot of the interest in direct indexing is based on using the S&P 500® Index as the investment benchmark—not surprising, since this is the most used index for passive ETF and mutual fund assets.2
However, investing in only the S&P 500 may have some drawbacks:
- Representing just the US equity market, which accounts for less than 64% of the world’s total public market capitalization3
- Providing exposure to only the largest companies in the US equity market, which misses small and midcap companies with strong growth potential
- Becoming increasingly concentrated in the largest stocks, with the top 10 companies by market cap representing over 38% of the S&P 500’s weight4
Investing solely in the S&P 500 ignores potential opportunities in other market segments that can also provide the benefits of direct indexing. If we compare the performance of several US and international indexes to the S&P 500, sorted each year by best performer to worst performer, we find a patchwork of index performance. Even the strong performance of the S&P 500 over the last decade has left openings for other benchmarks to outperform.
Patchwork of index performance over the past 10 years
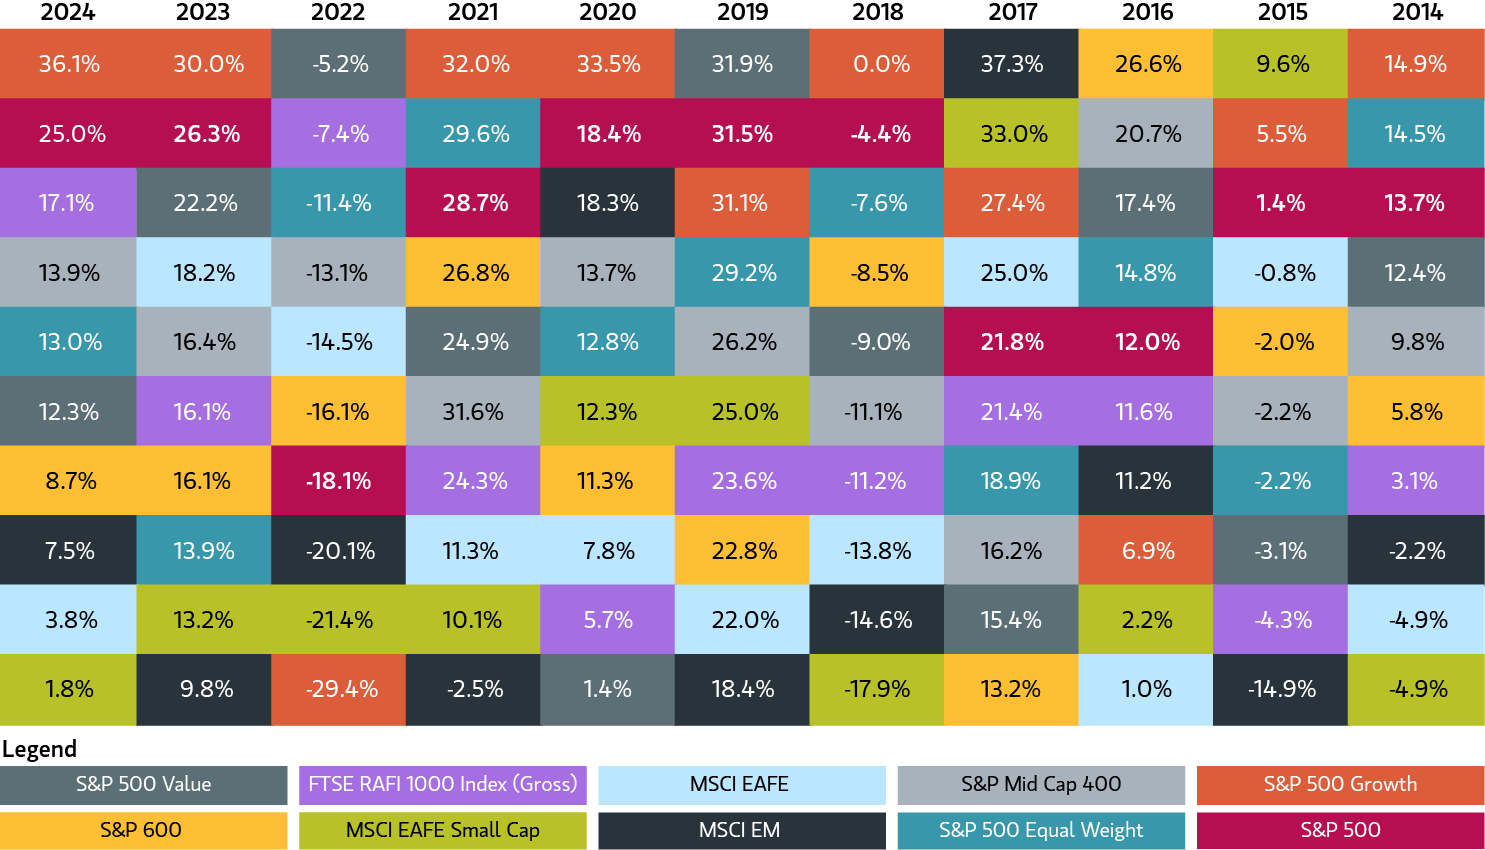
Source: FactSet, annual data from 2015 to 2024. For illustrative purposes. It is not possible to invest directly in an index. Indexes are unmanaged and do not reflect the deduction of fees or expenses. Past performance is not indicative of future results. All investments are subject to risks, including the risk of loss.
It’s impossible, of course, to predict which index will be the top performer in any given year, and no single index has even been the best performer consistently. That’s why financial advisors and investment professionals have tended to recommend a diversified approach covering multiple exposures.
Fortunately, investors have many alternative investment options available to them. Here are three ways investors can use direct indexing to diversify beyond the S&P 500 in a tax efficient way.
1. Investing internationally
While the US represents around 64% of the global investment universe, that leaves 36% to provide opportunities for investors to benefit from international trends—whether in developed markets like the UK, Germany and Japan, or in emerging markets like China and India. The most common indexes for achieving international exposure are the MSCI World ex US Index or the MSCI EAFE Index for developed markets and the MSCI Emerging Markets Index for emerging economies, or combining developed and emerging countries with the MSCI ACWI ex US Index. Clients can also gain global exposure including the US through MSCI World and MSCI ACWI.
Personalize tax managed portfolios around investor needs
2. Investing in small and midcap stocks
The two most common indexes that track US small caps are the S&P 600 Index and the Russell 2000 Index. Similarly, midcaps are often tracked by the S&P 400 Index and the Russell Midcap Index. Both the S&P 600 and the S&P 400 have delivered around 9% annualized returns over the last 20 years.5 By investing in smaller cap companies, investors may potentially benefit from additional drivers of growth and diversification.6
Direct indexing investors have the option to open separate accounts that focus on tracking only small caps or midcaps, or to combine them with large cap exposure in all cap or broad cap portfolios. For example, the S&P 1500 Index combines the S&P 500, S&P 400 and S&P 600 indexes, while the Russell 3000 Index combines the Russell 1000 and Russell 2000 indexes. Investors seeking to tilt toward specific market segments can also blend the benchmarks—for example, overweighting small caps in a broad cap exposure.
The same tax management techniques for managing S&P 500 direct indexing portfolios can be used on other exposures to help increase after-tax returns through tax loss harvesting and gain deferral.
3. Investing in alternative US large cap indexes
Investors concerned with increasing concentration in the S&P 500 may consider alternatively weighted indexes including the S&P 500 Equal Weight and the FTSE RAFI™ 1000 indexes.
The S&P 500 Equal Weight contains the same number of names, but each stock is weighted equally at 0.20% of the index, rebalanced quarterly and drifting between rebalancing dates. This avoids the concentration risks of the S&P 500—the 10 largest names in the index make up 38%7 of the S&P 500, but only 2% of the S&P 500 Equal Weight. With this equal weighted construction, the risk characteristics are much different than the market cap weighted S&P 500, so investors should expect different returns.
Some investors use a combination of the cap weighted and equal weighted versions to reduce the concentration—for example, a 50/50 combination would cut the concentration of the S&P 500 in half.
Also available as a direct indexing option at Parametric, the FTSE RAFI 1000 Index is an example of a fundamental index, which is built such that allocations are assigned to stocks based not on market value but on a measure of intrinsic value—for example, a company’s revenues, earnings, book value, dividends—or some combination of two or more measures.
In part, this mimics the type of analysis that a fundamental active investor may consider when evaluating stocks. Because the weighting is based on metrics of a company’s value—not simply the price that the market is willing to pay—the approach also attempts to reduce the chance that a stock would be overvalued based on sentiment or future expectations. Over the last 20 years, the FTSE RAFI 1000 Index has historically delivered annualized performance of 10.2%,8 similar to the S&P 500 during that period.
The bottom line
Investors in direct indexing have a lot of choices other than the S&P 500. Diversifying into international, small and midcap equities, or using alternative benchmarks may help complement their existing investments and potentially increase the tax efficiency of their portfolio through tax loss harvesting and gain deferral.
1 Source: Morningstar. as of 6/30/2025.
2 Cerulli Associates, Direct Indexing Assets Close Year-End 2024 at $864.3 Billion, April 10, 2025.
3 Source: MSCI, as of 6/30/2025, MSCI USA Index as a percent of the MSCI ACWI (All Country World Index).
4 Source: FactSet, S&P Global, as of 6/30/2025.
5 Source: FactSet, S&P Global, as of 6/30/2025, S&P 400 return 9.5%, S&P 600 return 8.7%.
6 Diversification does not eliminate the risk of loss.
7 Source: FactSet, S&P Global, as of 6/30/2025.
8 Source: FactSet, S&P Global, as of 6/30/2025.
Parametric and Morgan Stanley Investment Management do not provide legal, tax or accounting advice or services. Investors should consult with their own tax or legal advisors prior to entering into any transaction or strategy.
The views expressed in these posts are those of the authors and are current only through the date stated. These views are subject to change at any time based upon market or other conditions, and Parametric and its affiliates disclaim any responsibility to update such views. These views may not be relied upon as investment advice and, because investment decisions for Parametric are based on many factors, may not be relied upon as an indication of trading intent on behalf of any Parametric strategy. The discussion herein is general in nature and is provided for informational purposes only. There is no guarantee as to its accuracy or completeness. Past performance is no guarantee of future results. All investments are subject to the risk of loss. Prospective investors should consult with a tax or legal advisor before making any investment decision. Please refer to the Disclosure page on our website for important information about investments and risks.
08.01.2026 | RO 4702944