Sample transition analysis
Whether you fund your account with cash, existing securities, or a combination of the two, Parametric makes transitions easy, allowing you to choose how closely you want to track your selected benchmark balanced against any taxes you’ll owe. The illustration below, using a hypothetical portfolio, shows three potential transition scenarios, with different tax and tracking-error outcomes for each.
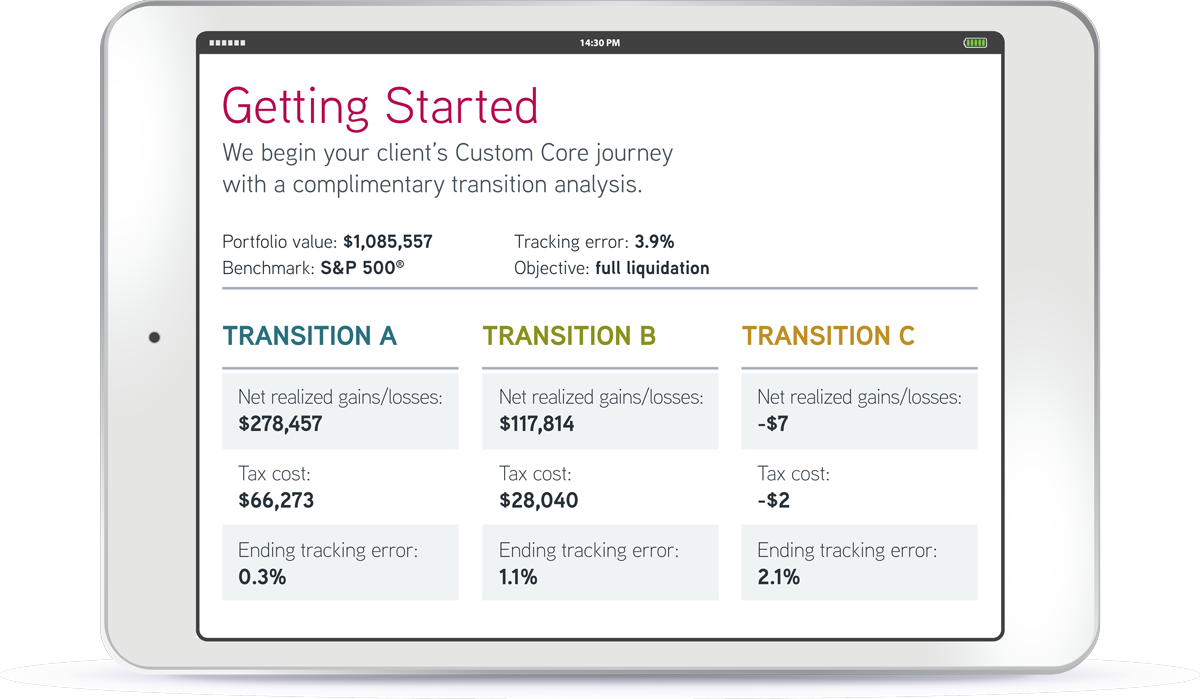
For illustrative purposes only. This is an example of a report that is available to clients and their advisors upon request. The content provided in the example is hypothetical and should not be relied upon to make investment decisions.
Regardless of the approach you take, Parametric can work to reduce tracking error over time to bring your holdings closer to your selected benchmark, typically without causing you to incur a significant tax penalty. Parametric can also complete the transition in stages, further driving down any potential tax liability.
Regardless of the approach you take, Parametric can work to reduce tracking error over time to bring your holdings closer to your selected benchmark, typically without causing you to incur a significant tax penalty. Parametric can also complete the transition in stages, further driving down any potential tax liability.
Request a Transition Analysis
To learn more and take advantage of our decades of experience, complete the form below and a member of our team will respond shortly.
How it works
Questions?
Want to know more about our custom SMA solutions? Complete our contact form, and a representative will respond shortly.