

We began the year optimistic that an environment of slowing growth, disinflation and easier monetary policy would be favorable for fixed income markets. Now at midyear, we maintain that view, while acknowledging that policy uncertainty and geopolitical risks may likely result in continued volatility.
What factors do fixed income investors face?
Despite tariff-induced volatility over recent months, economic growth, labor markets and consumers have remained resilient. With trade tensions cooling, we expect the effective tariff rate of 13% could potentially help to avoid a recession.
Yet along with heightened business uncertainty related to uneven policy communication, more consumer caution may weigh on growth and lift the unemployment rate. Inflation remains above the Federal Reserve’s target, and tariff pass-throughs may lead to a near-term uptick in price pressure. Absent a meaningful deterioration in the labor market, US monetary policymakers could remain guarded.
In June, the Fed kept rates unchanged for a fourth consecutive meeting, and the median dot in the assessment of appropriate monetary policy continued to project two rate cuts this year. By the end of 2026, however, the Fed and the market both expect the federal fund rate to be a full 1% lower than where it stands today. This could be a tailwind for the rest of year—and beyond.
Fiscal policy is also likely to play a large role in shaping the second half of 2025. At this point, it appears that the budget/tax bill may raise the deficit and increase the size of US government debt, which is already at levels that are beginning to stress the market. The prospect of higher borrowing costs and elevated Treasury issuance is increasing the Treasury Term Premium and putting pressure on long-term yields.
In our view, higher debt and deficits are likely to keep us in a higher and steeper rate regime. Steeper yield curves could continue to be a dominant theme for the rest of the year.
Where do we see opportunity?
Combining these factors, yields in most fixed income sectors remain 50 to 100 basis points (bps) higher than when the Fed first began cutting rates in September 2024. With a yield above 5%, the ICE BofA 1–10 Year Corporate Index is 122 bps above its 20-year average. Over that same period, the yield on the ICE BofA Municipal Index has been higher only 13% of the time.
In our opinion, we see opportunity when investment grade (IG) corporate yields over 5% and tax-free municipal bond yields of 3.0% to 4.5%—equating to taxable equivalent yields from 6% to 9% (assuming a 40.3% tax rate in the highest brackets)—represent potential value.
Why do starting yields matter?
Starting yields are one of the most important factors driving the performance of fixed income investments. Higher starting yields typically correlate to higher forward returns. Over the past five years, most fixed income sectors have underperformed their longer-term averages. With yields well over their 10-year highs, we are optimistic that return profiles going forward could prove to be more attractive.
We believe bonds should play a larger role in asset allocation strategies—offering income, total return and diversification.
Let’s consider the average 3-year annualized forward returns for the ICE BofA Municipal Index and the ICE BofA 1–10 Corporate Index based on starting yield to worst. We see that on average, as the yield to worst of the index has increased, so has the forward annualized 3-year return. For example, following all starting yields between 5% and 6%, the average annualized 3-year return for the ICE BofA 1–10 Year Corporate Index has been 5.56%.
Average 3-year annualized forward returns based on starting index yield to worst (%)
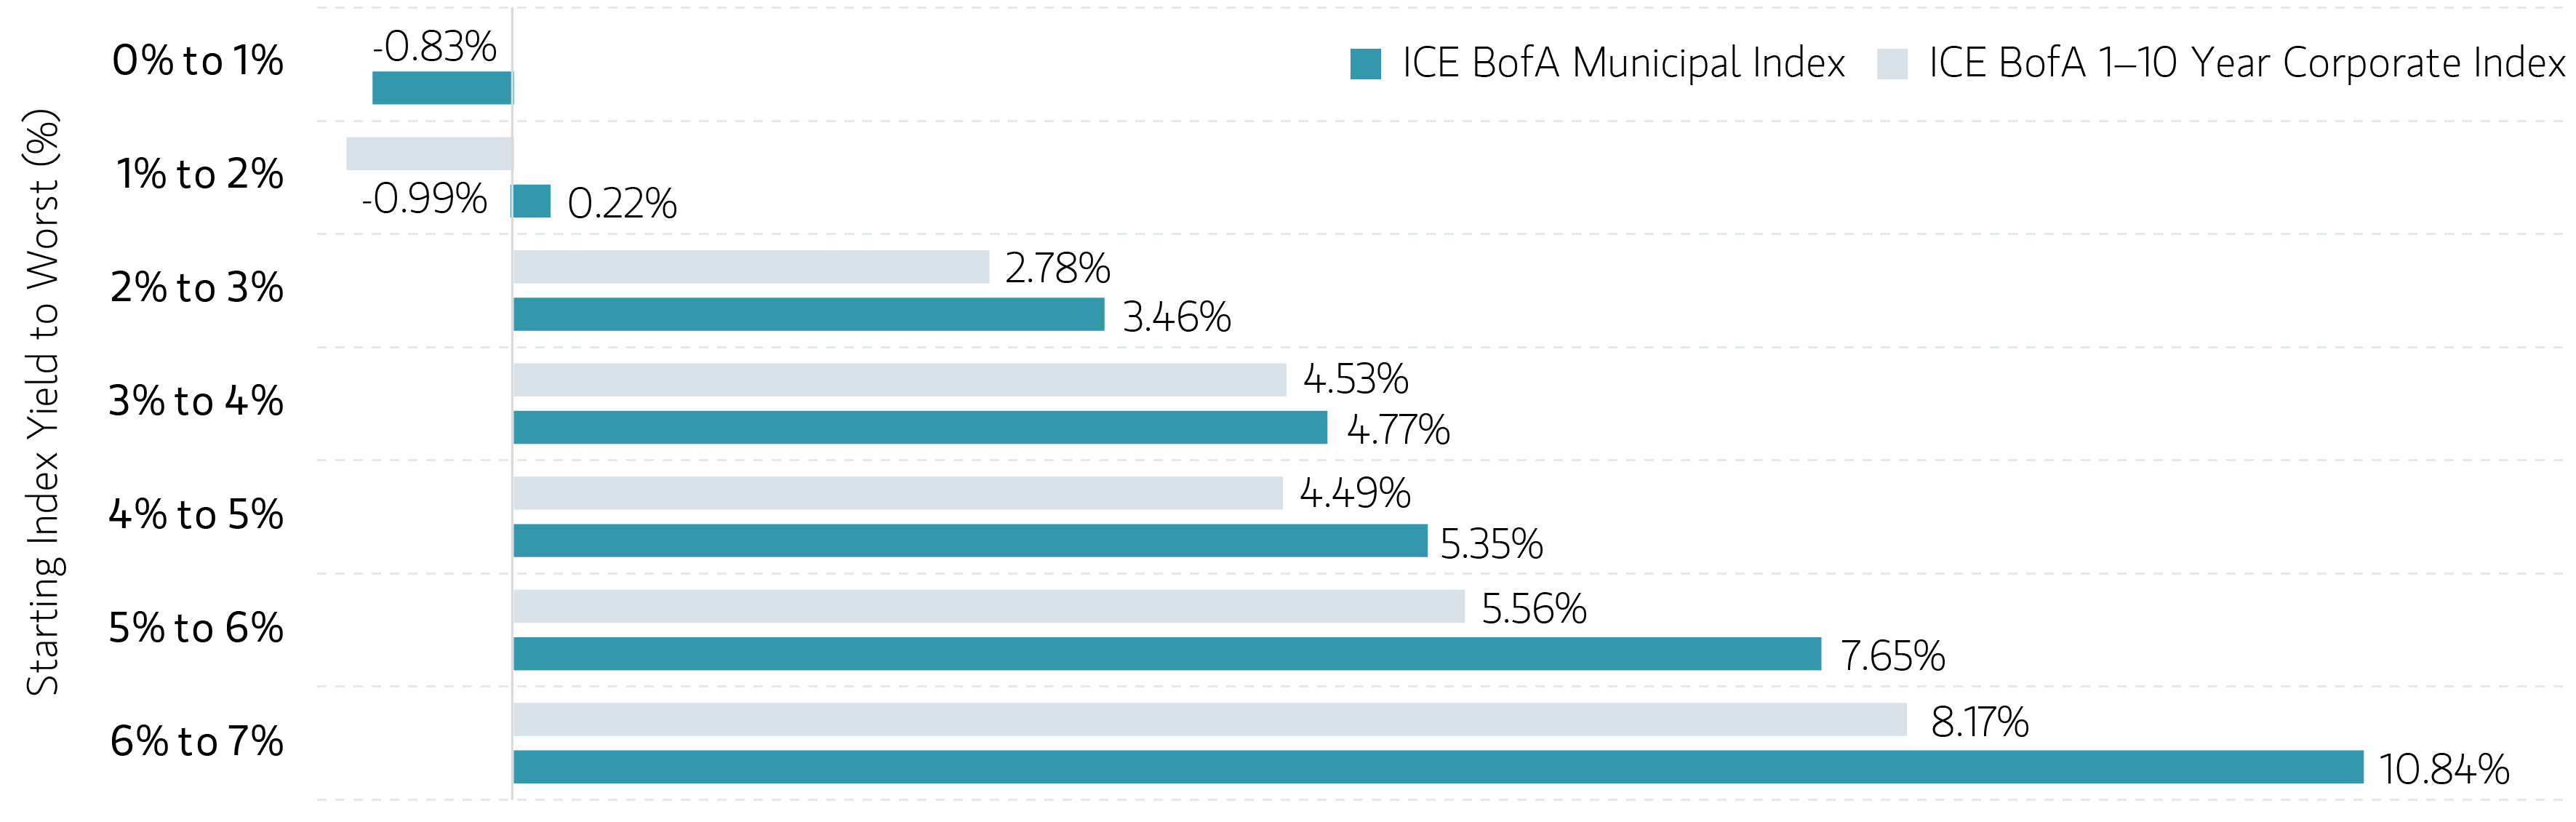
Source: Parametric and ICE BofA index returns. Data analyzed from 5/1/2000 through 5/1/2025. Starting yields are represented by index yield to worst. Starting yields and forward index returns based on daily values for the last 25 years. It is not possible to invest directly in an index. Indexes are unmanaged and do not reflect the deduction of fees or expenses. Past performance is not indicative of future results.
Higher starting yields have also tended to provide more cushion in the event of rate volatility. We believe rates are biased lower and the curve steeper in the near term—potentially leading to positive performance in the year ahead. Should yields increase from here, however, the income offered in today’s higher rate environment may help to minimize downside performance. Our analysis suggests that when looking at an equivalent move in yields either lower or higher, the payout has been asymmetric.
Tax loss harvesting (TLH) can be an active component of fixed income strategies, with added benefits in a fixed income portfolio where proceeds from maturing bonds, calls and coupons offer ongoing opportunities for reinvestment at current rates, resetting the cost basis and book yields higher. Advisors and investors who want more information about this approach can download Parametric’s Tax Optimized Ladder strategy overview and use our Laddered Interest Rate Scenario Tool to assess different scenarios.
Transform fixed income opportunities into optimization
The bottom line
Most fixed income sectors have posted positive performance year to date. We could see this continuing over the second half of the year, albeit with persistent volatility. While elevated debt and deficits may keep rates above levels witnessed over the past decade, we believe slower growth and ongoing disinflation could drive yields lower in the near term.
Income on cash sweeps, CDs and T-bills may be attractive, yet we see value in extending out on the curve, getting some duration in a portfolio and locking in yields at or near decade highs. Compared to recent years, higher starting yields may result in more attractive return profiles for fixed income investments going forward. Elevated income could also provide a cushion to limit downside risk amid continued rate volatility.
Here’s our outlook for munis, corporates and preferreds in the second half of 2025:
Municipals
Yield
- Municipal yields are up 50–100 bps since the Fed began cutting rates in September 2024. The yield on the ICE BofA Municipal Index has been higher only 13% of the time over the past 20 years.
- Today’s yields are above the levels witnessed during previous historic sell-offs—for example, Meredith Whitney’s default prediction in late 2010, the “taper tantrum” in 2013, post-election in 2016 and the COVID-related liquidity crunch in 2020. Those weaker markets ultimately became attractive entry points. We think the current environment potentially offers similar opportunity.
- The muni curve is steep, and buyers are being paid to extend. The spread between 2-year and 20-year yields (known as 2s–20s) on the muni curve is 150 bps, compared to only 96 bps on the US Treasury curve. That may benefit investors who can step out of cash, lock in yields at over a decade high and get some duration in their portfolios.
Supply/demand technicals
- Muni fund inflows totaled $9.4 billion year to date through June 20, with eight consecutive weeks of inflows heading into midyear. We expect this solid momentum to continue. Rate cutting cycles have typically been favorable environments for fund inflows, with muni funds experiencing net positive inflows in the last six easing cycles.
- The market is on pace for a record year of new issue volume over $500 billion—30% above the trailing 5-year average. Elevated issuance is the one of the contributors to the municipal market’s year-to-date underperformance compared to taxable alternatives. However, a surge in reinvestment capital from coupons, calls and maturities could keep the market well supported over the summer months.
- Tax-exempt yields in the 3.0% to 4.5% range tend to keep buyers engaged. For investors in higher tax brackets who face tax rates up to 40.3%, this could equate to tax adjusted yields of 6% to 9%—comparable to equity market returns.
Credit fundamentals
- Municipal credit remains on a solid footing. Rainy day balances averaged a solid 14% of state expenditures in 2024 and are expected to climb to 15% in 2025. Healthy reserves and liquidity could help states manage cuts to Federal Medicaid grants with minimal impact to ratings. We expect muni credit spreads to remain unchanged or tighten slightly given the current solid economic backdrop. Upgrades have outpaced downgrades for 17 consecutive quarters.
- As we anticipated, adjustments or curtailments to the muni tax exemption now seem unlikely. Such measures aren’t included in the budget and tax bill passed by the House and making its way through the Senate. We believe that threat is behind us for now.
Corporates
Yield
- Investment grade corporate bond yields are up 50–75 bps since the Fed began cutting rates in September 2024. The yield on the ICE BofA 1–10 year Corp Index has been higher only 30% of the time over the past 20 years.
- Investors now earn high starting yields over 5%, which also help to insulate them from future rate increases.
Returns
- The ICE BofA 1–10 Year US Corporate Index has generated a 3.5% total return year to date through June 20, with the potential to post a double-digit return over the next 12 months based on its attractive starting yield, falling Treasury rates and stable spreads.
- Returns between BBB and A rated bonds have performed in line with one another, with BBB outperforming by just 13 bps. BB bonds have outpaced BBB bonds by 57 bps.
Demand/supply technicals
- • As fixed income continues to compete for portfolio share amid slowing growth and rich equity valuations, IG yields over 5% and positive performance indicators may help to keep buyers engaged.
- Demand for IG corporates as measured by ETF and fund flows has been uneven year to date, with large outflows occurring during tariff-related market sell-offs. IG corporates have so far recorded outflows of $300 million, with net negative outflows coming entirely from long duration products.
- We expect supply to grow modestly over the remainder of 2025. Recent volatility may encourage management teams to adopt even more conservative strategies, leading to less issuance for M&A activity.
- Year to date, the par amount of IG bonds in the ICE BofA Corporate Index has increased by 2.5%. Over the past 10 years, the market has nearly doubled in size to $9.4 trillion.
Spreads
- In our view, investors have become more yield oriented and less focused on the level of spreads.
- IG spreads over US Treasurys have retraced their moves since Liberation Day on April 2. After rising to 130 bps amid tariff-related volatility, spreads are now back to 90 bps—in line with historical averages. If growth exceeds expectations, we may see the retesting of all-time lows at 70 bps.
- Spreads have proved to be resilient and stable at tight levels over long periods of time. Absent an external catalyst, we think strong demand, lighter supply and healthy earnings and balance sheets could keep spreads supported at these tights.
Credit fundamentals
- Corporate balance sheets are in solid shape, with leverage low by historical standards. Cash levels are elevated, and interest coverage ratios have been improving. So far this year, upgrades have outpaced downgrades two to one. Future ratings trends point to continued improvement: 2.6% of the index is on positive outlook/watch—well above the 15-year median of 1.6%.
- Our credit team has identified and limited losses associated with all 53 fallen angels since 2020. Positive ratings momentum continued during the first half of the year, with 5.7 issuers on our approved list upgraded for every issuer downgraded—compared to a healthy 2.4 upgrade/downgrade ratio for the overall IG market.
- With trade issues settling down, we could see the resiliency of the domestic economy prevailing. While we anticipate some economic slowing, we don’t expect to tip into a recession. Intermediate corporate bond yields remain 0.4% higher than the peak levels registered during the pandemic sell-off in March 2020.
Preferreds
- In our view, high yields in preferred securities may continue to attract investor demand following solid performance in the first half of 2025. Valuations have recovered toward longer-term averages, but credit spreads remain supported by stable fundamentals and light new issuance. In a coupon-driven environment, we believe after-tax income advantages still support allocations to preferreds.
- Financial sector fundamentals remain healthy, with large US banks reporting stable credit quality, solid capital levels and limited direct exposure to trade-related pressures. Modest reserve builds have largely reflected Current Expected Credit Losses (CECL) model assumptions rather than realized credit losses. While loan growth remains soft, bank management teams are optimistic that activity could improve modestly in the second half as macroeconomic clarity improves.
- Capital markets started the year strong before trade policy uncertainty hit markets in early April. Activity rebounded through the second quarter, helping to stabilize fee income and offset soft lending trends. Management commentary from recent investor conferences suggests a more constructive investment banking outlook for the remainder of 2025, particularly if tariff and fiscal uncertainties ease.
- Utilities represent a growing segment of preferred and hybrid issuance. We expect supply from electric utilities to remain elevated as firms fund large-scale capital expenditure programs tied to grid modernization and renewable infrastructure, along with incremental demand growth from AI-related data center buildouts. The sector remains largely insulated from trade policy volatility, with fundamentals anchored by regulated earnings and stable credit profiles.
- Despite small ETF outflows earlier this year, technicals remain favorable, supported by ongoing tenders, redemptions and call activity. We anticipate that portions of the robust 2020 preferred issuance vintage will continue to be called or refinanced in the back half of 2025—particularly among fixed to floating structures approaching reset dates.
- Fixed to floating rate preferreds have meaningfully outperformed fixed for life perpetuals in this higher-for-longer rate environment, benefiting from lower duration, lower volatility and rising coupons as reset spreads activate. We continue to view structural positioning as a key driver of risk-adjusted returns within preferred allocations.
- Historical periods with elevated rates and steady growth—such as the mid-1990s and early 2000s—have produced positive total returns for preferred investors, driven primarily by coupon income. We believe valuations appropriately reflect sector strength, technical support and a favorable macro backdrop for income-oriented investors. Qualified Dividend Income (QDI) preferred structures have offered equity-like high single-digit after-tax returns with lower volatility.
Parametric and Morgan Stanley do not provide legal, tax or accounting advice or services. Clients should consult with their own tax or legal advisor prior to entering into any transaction or strategy.
The views expressed in these posts are those of the authors and are current only through the date stated. These views are subject to change at any time based upon market or other conditions, and Parametric and its affiliates disclaim any responsibility to update such views. These views may not be relied upon as investment advice and, because investment decisions for Parametric are based on many factors, may not be relied upon as an indication of trading intent on behalf of any Parametric strategy. The discussion herein is general in nature and is provided for informational purposes only. There is no guarantee as to its accuracy or completeness. Past performance is no guarantee of future results. All investments are subject to the risk of loss. Prospective investors should consult with a tax or legal advisor before making any investment decision. Please refer to the Disclosure page on our website for important information about investments and risks.
06.30.2026 | RO 4607952