
For many years, the pension plan has often been a drag on a corporation’s financial positions. Now that’s generally no longer the case, and it’s time to consider what’s next.
Corporate pension plans mostly find themselves in a strong position, thanks to evolving strategies over the past 25 years. After we review the current landscape, let’s consider what may be on the horizon for these plans.
Despite spikes of volatility in the first months of 2025—VIX peaked above 50 and MOVE above 140, highs since the pandemic and over the last couple of years, respectively—markets and corporate pension funding levels have remained fairly stable through the first half. The Milliman 100 Pension Funding Index began the year at 103.6% and ultimately rose to 104.9% at the end of May—a funded level we haven’t seen since before the global financial crisis in 2008 and the tech bubble in 2001.
Milliman 100 Pension Funding Index has improved in 2025
Source: Milliman, 5/31/2025. For illustrative purposes only. Past performance is not an indicator of future results. It is not possible to invest directly in an index. Indexes are unmanaged and do not reflect the deduction of fees or expenses.
How do we view the environment for pension investing?
Throughout the year, as broad market bonds have slightly outperformed US equities, market returns and liability returns have combined to leave funded ratios in a now familiar spot. Long bonds have produced slightly lower returns than US equities and broad market bonds. That’s consistent with liability returns below equities and broad market bonds, given that their duration is typically on the longer side.
Year-to-date index total returns through May

Source: Parametric, 5/31/2025. For illustrative purposes only. Past performance is not an indicator of future results. It is not possible to invest directly in an index.
This may look like where we started the year, yet lower returns for long bonds than for broad market bonds point to an interesting shift: For years, market yields had been relatively flat across maturities. Since the beginning of 2025, yield curves have steepened markedly. Through May 31, the 2-year/30-year yield spread shifted from 53 to 102 basis points (bps), and the 5-year/30-year spread went from 41 to 97 bps.
While yield levels still have the most influence on bond and liability returns, the slope of the curve is showing more impact now than for quite some time. We think this warrants monitoring as we move forward.
How are plan allocations evolving?
Mediocre returns across the board for assets and liabilities disguise another reason why we might expect to see funded ratios remain pretty stable—even in a world of higher and varying asset returns. As funding levels have continued to improve, plans have shifted asset allocations along their investment glide paths to a larger weight on fixed income, which behaves more like their liabilities than equities do.
Furthermore, plans have continued allocating a sizable chunk of their assets to alternative investments, which have reported returns that are smoothed because they are not priced by public markets. In 2024, the Milliman 100’s average asset allocation was 52.4% in fixed income, 24.6% in public equities and 23.0% in other assets like private equity, hedge funds, real estate, infrastructure and private credit.
This is a far cry from the old 60/40 or 70/30 equity/bond allocations that prevailed through the early 2000s. For the past 25 years, focusing on asset/liability relationships has led to stronger, more stable funding for corporate pensions.
Where do we see the trends in risk transfers and buyouts?
With better funded ratios, there’s been greater interest in pension risk transfers (PRT) in recent years, as we’ve discussed before. Now with even higher funded ratios, we might expect to see more interest in this strategy. Through the first quarter of 2025, however, we’ve observed fewer liabilities transferred to insurance companies through pension buyouts—the lowest quarterly value in two years.
LIMRA pension buyout sales continuing long-term trend through Q1 2025
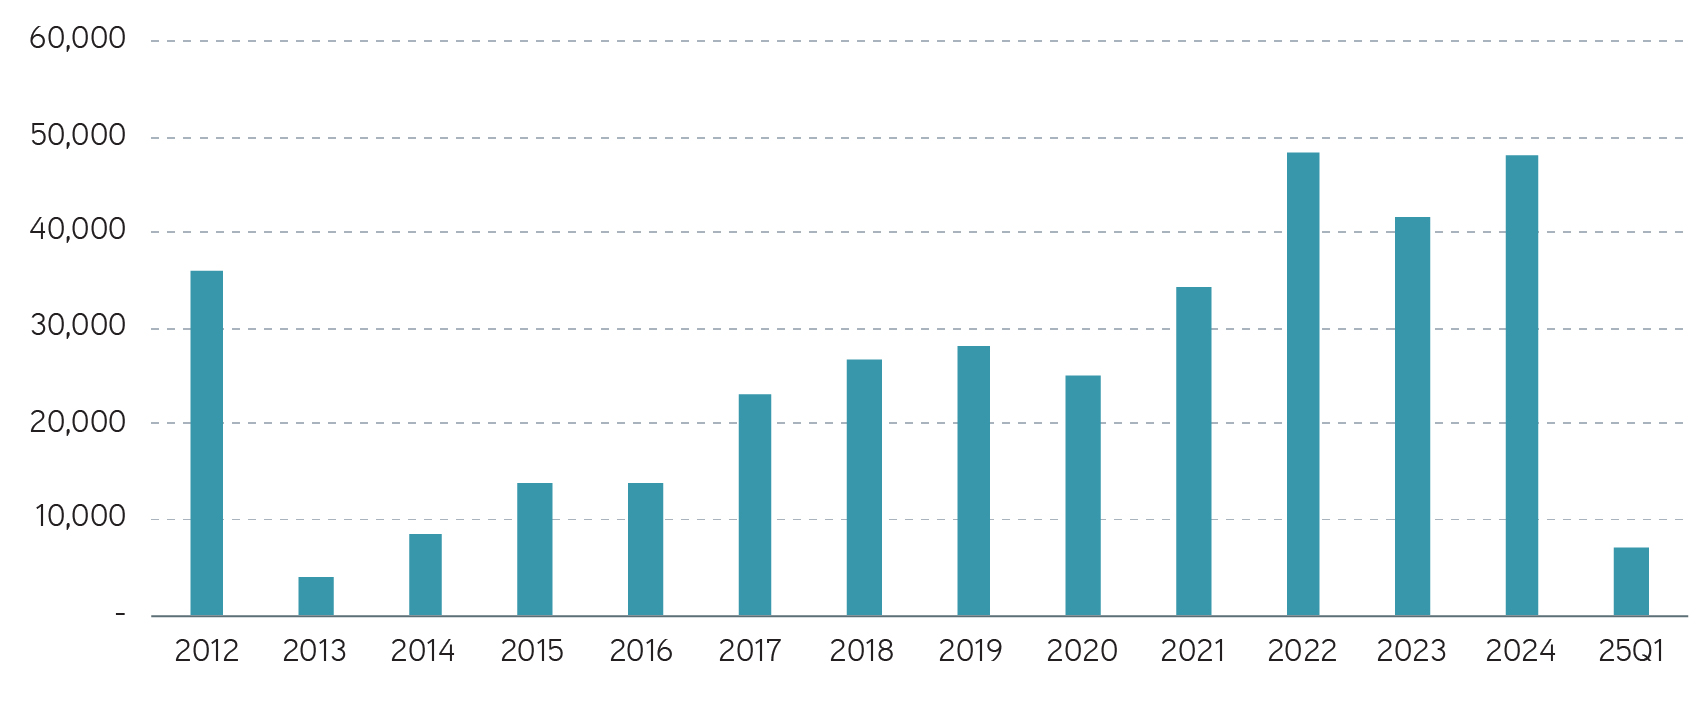
Source: LIMRA data as of 3/30/2025. For illustrative purposes only. Past performance is not an indicator of future results. It is not possible to invest directly in an index.
While market uncertainty could be leading to some hesitation in buyout activity, we note that first quarter buyout numbers have usually been smaller than other quarters. It remains to be seen if buyouts over the full year will bounce back up to the levels of recent years.
Refine and enhance liability-driven investing strategies
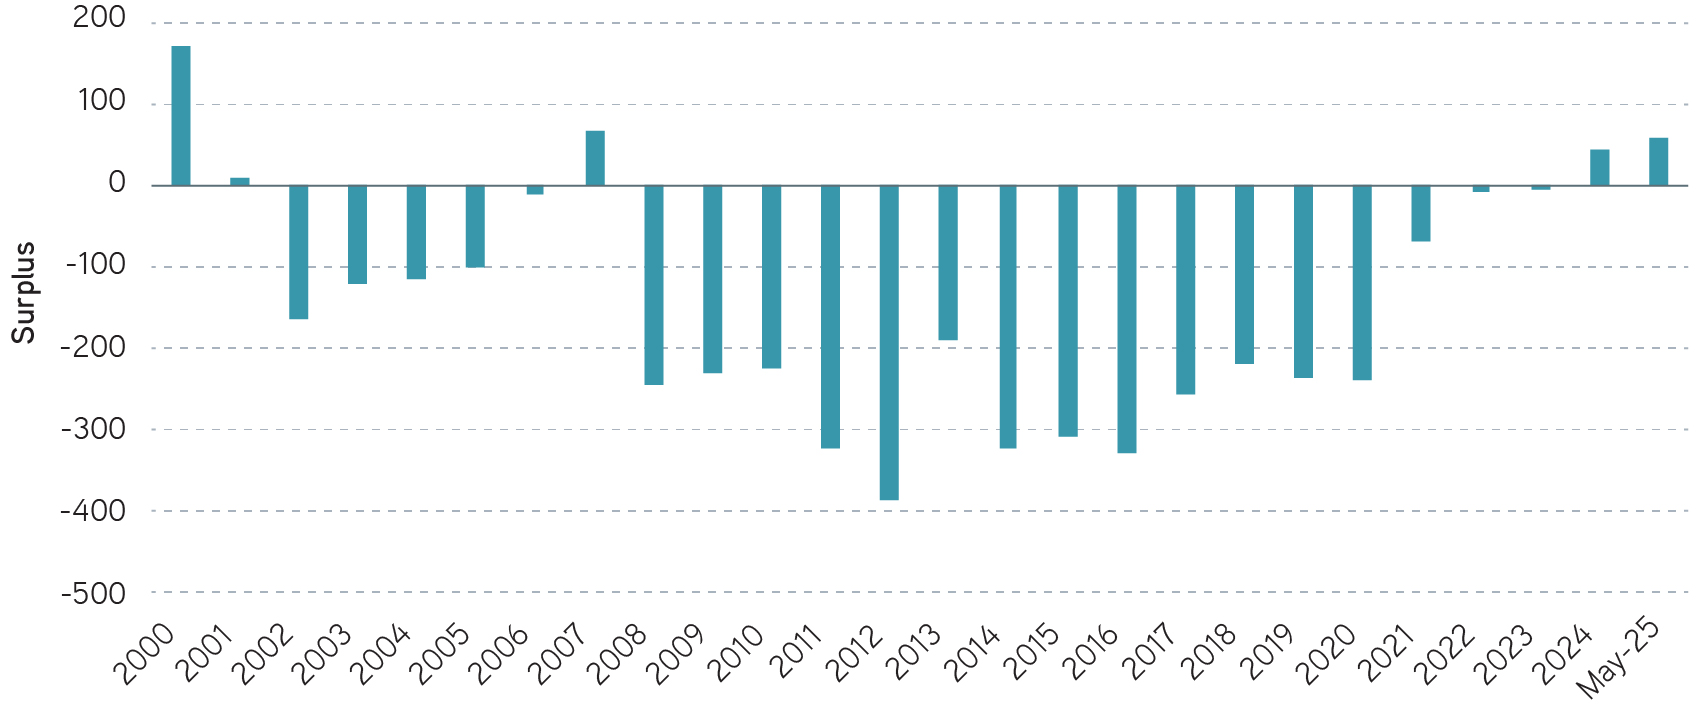
How can plans use surplus assets?
Excess assets are trapped to a large degree in the plan by design, with the idea being that participants’ needs for retirement income need to be as secure as possible. Sometimes a plan really does have more than it needs to secure retirement promises. In those cases, there are ways to harvest some benefit from a fortunate excess funding position, which includes using the assets to improve the plan for current and future participants.
Recognizing that few plans are excessively overfunded, we may be getting ahead of ourselves by asking if there are ways to make use of surplus assets trapped in the pension plan. But there’s no harm in thinking ahead, and this question has been asked before—particularly leading up to the tech bubble and the global financial crisis, which caused well-funded plans to become not so well-funded.
Assets contributed to these plans aren’t taxed, and excise taxes apply for reversions of assets to the corporation. So if a plan is terminated at a cost lower than the assets in the plan, any remaining assets returned to the corporation would need to be taxed at their corporate tax rate, plus another 50% for the excise tax. That may leave only a small percentage to be returned.
Ideally, the corporation would find a more valuable way to apply the assets to another area without taxation. As the same rules apply, the options haven’t changed much over the years:
• Hibernate and hedge, that is, let the plan run its course while using excess assets to pay plan expenses
• Open a closed plan and use excess assets to fund future accruals
• Enhance benefits through a COLA or other plan amendment
• Merge the plan with an underfunded plan in an acquisition
• Fund health benefits through a Section 420 transfer to a post-employment 401(h) plan (typically limited to excess assets over 125% funding, or 110% if the transfer is less than 1.75% of assets)
• Terminate and revert the assets to the company with a major haircut
The bottom line
Lessons have finally been learned from funding declines related to markets during the tech bubble, global financial crisis, sovereign debt crisis and COVID-19 pandemic. Before, pensions may have failed to secure their positions by matching assets with liabilities. Now plans are better oriented. Asset/liability risk analysis has illuminated the benefit of interest-rate hedging and taking appropriate levels of risk for given funding situations and corporate financial circumstances.
Pensions are in stronger positions because they’ve shown discipline and followed glide paths to higher and more stable funded ratios. With plans better prepared for market volatility than ever before, we expect to see fewer drastic moves in corporate pension funding ratios.
Cboe Volatility Index or VIX is a calculation designed to produce a measure of constant, 30-day expected volatility of the US stock market, derived from real-time, mid-quote prices of S&P 500® Index call and put options.
ICE BofA MOVE Index (formerly Merrill Lynch Option Volatility Estimate) measures the implied volatility of US Treasury options across various maturities.
The views expressed in these posts are those of the authors and are current only through the date stated. These views are subject to change at any time based upon market or other conditions, and Parametric and its affiliates disclaim any responsibility to update such views. These views may not be relied upon as investment advice and, because investment decisions for Parametric are based on many factors, may not be relied upon as an indication of trading intent on behalf of any Parametric strategy. The discussion herein is general in nature and is provided for informational purposes only. There is no guarantee as to its accuracy or completeness. Past performance is no guarantee of future results. All investments are subject to the risk of loss. Prospective investors should consult with a tax or legal advisor before making any investment decision. Please refer to the Disclosure page on our website for important information about investments and risks.
07.14.2026 | RO 4660887