


Market volatility—and the feelings of uncertainty that follow—tend to frighten investors. Yet for investors with an overlay program, one approach to volatility is evergreen—rebalancing.
Amid the market turbulence after the Liberation Day tariff announcements, Parametric was asked how our clients have approached the uncertain investment landscape. With the tool of rebalancing, volatility and market turbulence can be seen as opportunities rather than obstacles in the investment process.
At their core, rebalancing programs seek to reduce portfolio drift away from the long-term strategic asset allocation. Overweight asset classes that have outperformed can be sold at relatively high prices and underweight asset classes that have underperformed can be bought at relatively low prices—manifesting the core investment philosophy of buy low, sell high.
How has rebalancing found opportunity so far in 2025?
For a rebalancing program, volatility and differential asset class performance can act as a buoy, potentially providing greater opportunities.
Take, for example, the year-to-date performance of the MSCI All Country World Index (ACWI) relative to the Bloomberg US Treasury Index.
Cumulative return year to date for MSCI ACWI and Bloomberg US Treasury
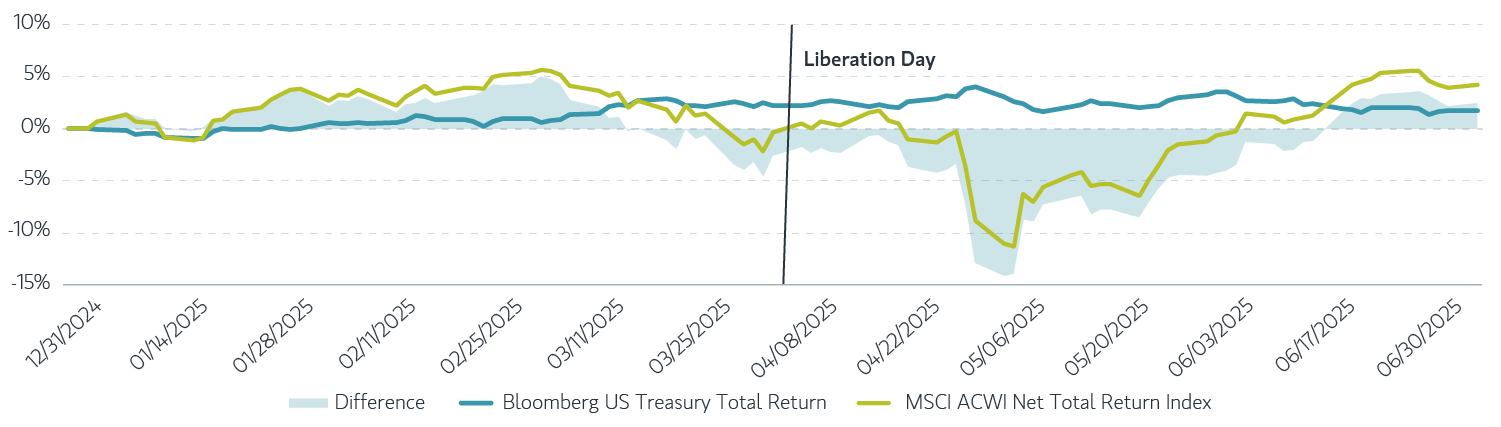
Source: Bloomberg and Refinitiv, data from 12/31/2024 to 6/30/2025. For illustrative purposes. It is not possible to invest directly in an index. Indexes are unmanaged and do not reflect the deduction of fees or expenses. Past performance is not indicative of future results. All investments are subject to risks, including the risk of loss.
Prior to Liberation Day in April, the difference in equity versus bond returns ranged from -5% to 5% with an average difference of 0.6%. Following Liberation Day, that performance differential nearly tripled to a low of -14%.
Much commentary since 2022 has focused on how the elevated stock-bond correlation has created headwinds to the diversification1 of a traditional 60/40 portfolio. Prior to 2022, this correlation was largely negative, resulting in clearer rebalancing opportunities as asset classes move in opposing ways. Since mid-2022, that relationship has been trending positive, potentially reducing these rebalancing opportunities.
Correlation of MSCI ACWI and Bloomberg US Treasury
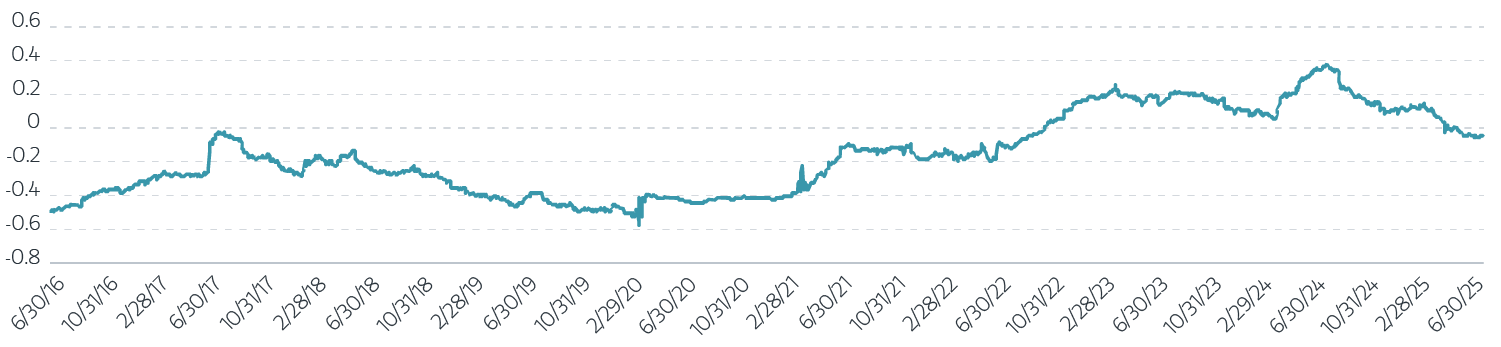
Source: Bloomberg and Refinitiv, data from 5/29/2015 to 6/30/2025. For illustrative purposes. It is not possible to invest directly in an index. Indexes are unmanaged and do not reflect the deduction of fees or expenses. Past performance is not indicative of future results. All investments are subject to risks, including the risk of loss.
However, for all the handwringing about positive stock-bond correlation, we still see value in rebalancing on an asset allocation basis—as long as there is disproportionate relative performance between the asset classes.
Customized overlays for institutional risk management
The bottom line
Parametric employs a variety of rebalancing approaches. Most commonly, we review asset class drift daily and rebalance based on predetermined thresholds. For example, a 60/40 portfolio might rebalance once it drifts to 58/42.
Another approach is to establish a total portfolio tracking error budget. Through this rebalancing methodology, portfolios are monitored holistically, and the portfolio is rebalanced when the total expected tracking error exceeds a predetermined budget.
Regardless of the approach used, Parametric believes that a rules-based systematic program is key to the successful implementation of rebalancing.
1 Diversification does not eliminate the risk of loss.
A program of regular rebalancing cannot assure a profit or protect against a loss in a declining market.
The views expressed in these posts are those of the authors and are current only through the date stated. These views are subject to change at any time based upon market or other conditions, and Parametric and its affiliates disclaim any responsibility to update such views. These views may not be relied upon as investment advice and, because investment decisions for Parametric are based on many factors, may not be relied upon as an indication of trading intent on behalf of any Parametric strategy. The discussion herein is general in nature and is provided for informational purposes only. There is no guarantee as to its accuracy or completeness. Past performance is no guarantee of future results. All investments are subject to the risk of loss. Prospective investors should consult with a tax or legal advisor before making any investment decision. Please refer to the Disclosure page on our website for important information about investments and risks.
07.24.2026 | RO 4685635