

A rising S&P 500® might suggest few opportunities for tax-loss harvesting. But unusually wide dispersion among individual stocks is telling a different story—and potentially creating new opportunities for direct indexing.
Tax-loss harvesting is often associated with market downturns. Yet rising markets can afford some of the most productive loss-harvesting opportunities when dispersion among individual stocks is high. That has been the case so far in 2026. While the S&P 500® has continued to advance, individual stock returns have diverged sharply, creating a steady supply of tax-loss harvesting opportunities despite positive index performance.
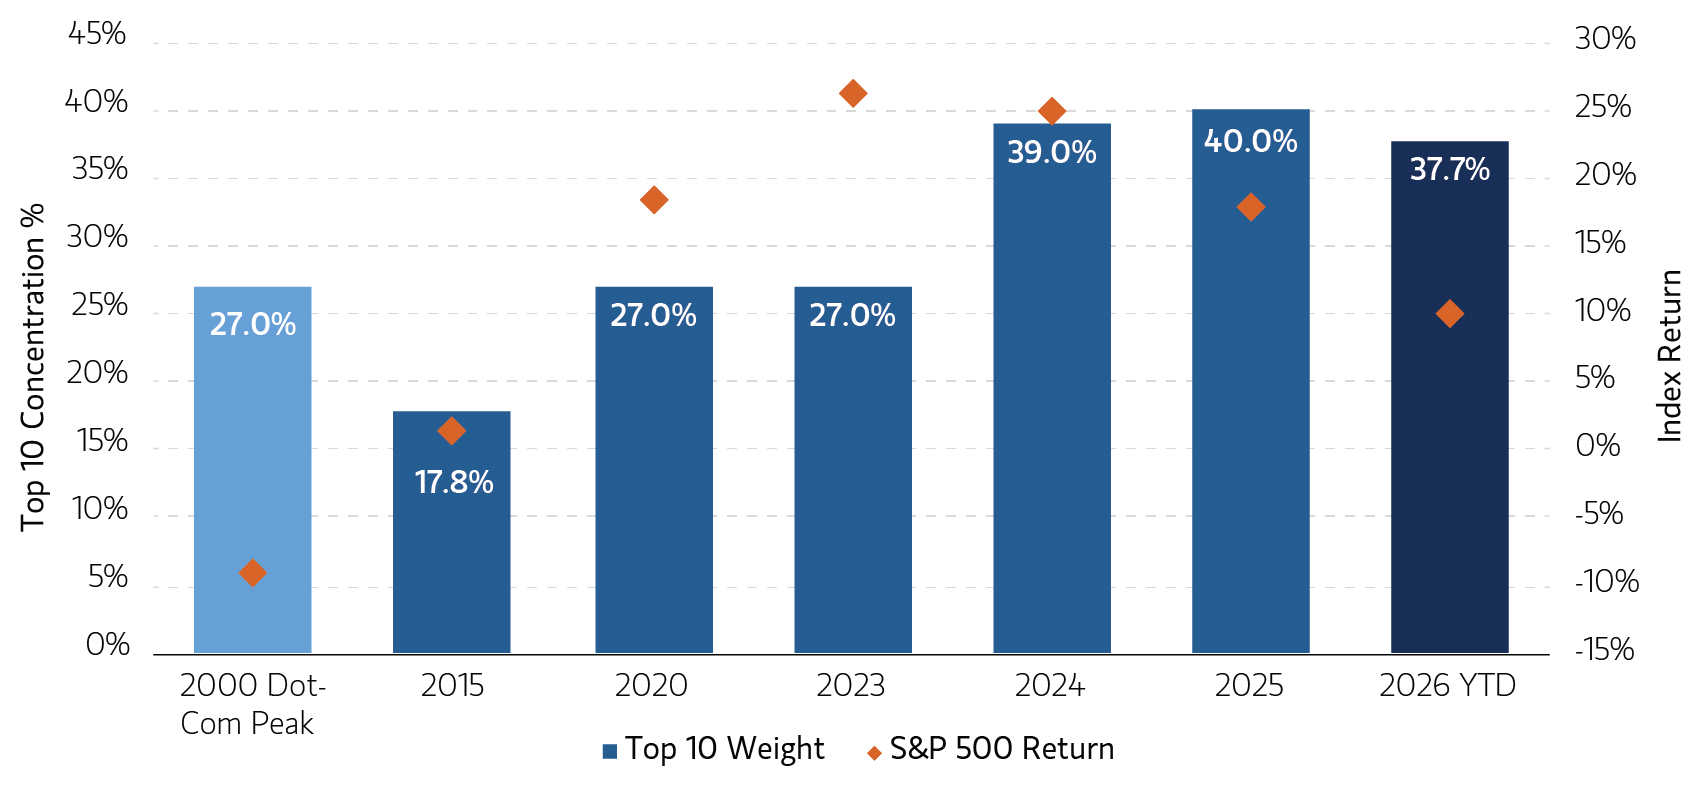
The market also remains historically concentrated, with a small group of mega-cap stocks accounting for an outsized share of index weight and returns. Rather than being mutually exclusive phases, concentration and dispersion are occurring side by side. This potentially creates a highly favorable environment for direct indexing, where investors may be able to participate in the gains from market leaders while harvesting losses among the many stocks that lag.
When concentration and dispersion coexist
By the end of 2025, the largest 10 companies in the S&P 500® accounted for 40.7% of the index, reflecting three years of relentless growth by the Magnificent Seven (Mag-7) and AI-related technology stocks. That number represents roughly twice the weight of the top 10 holdings that prevailed through much of the 1980s, 1990s and 2010s. In recent years, “extreme concentration” has dominated the stock market narrative.
Seven months into 2026, however, dispersion has emerged as a defining feature. Yet a closer look beneath the index’s surface shows that dispersion has not displaced concentration, but rather the two are coexisting side by side. While it remains uncertain how long this market “odd couple” will coexist, the pairing potentially creates a favorable dynamic for direct indexing portfolios.
S&P 500® Concentration and Returns Since the Dot-Com Peak (as of 7/31/2026)
Source: LSEG, S&P Global, as of July 31, 2026. For illustrative purposes only. Not a recommendation to buy or sell any security. It is not possible to invest directly in an index. Indexes are unmanaged and do not reflect the deduction of fees or expenses. Past performance is not indicative of future results. All investments are subject to risk, including the risk of loss.
From concentration to greater breadth
For much of the past three years, investors have accepted concentration as a fixed feature of the indexing landscape. Despite periodic attempts to rotate away from the top 10 heavyweights, investors have repeatedly shifted assets back into big tech and AI, reluctant to miss out on earnings growth. That story began to change early this year, as concerns grew that valuations had moved too far ahead of earnings expectations to justify continued investment in the mega-cap giants. This shift in sentiment is reflected in the growing gap between the top 10 stocks’ index weight and their contribution to earnings. Today, the top 10 account for roughly 30% to 32% of S&P 500® index earnings but 40.7% of its weight—a meaningful divergence compared with 2015, when both figures stood near 19%.
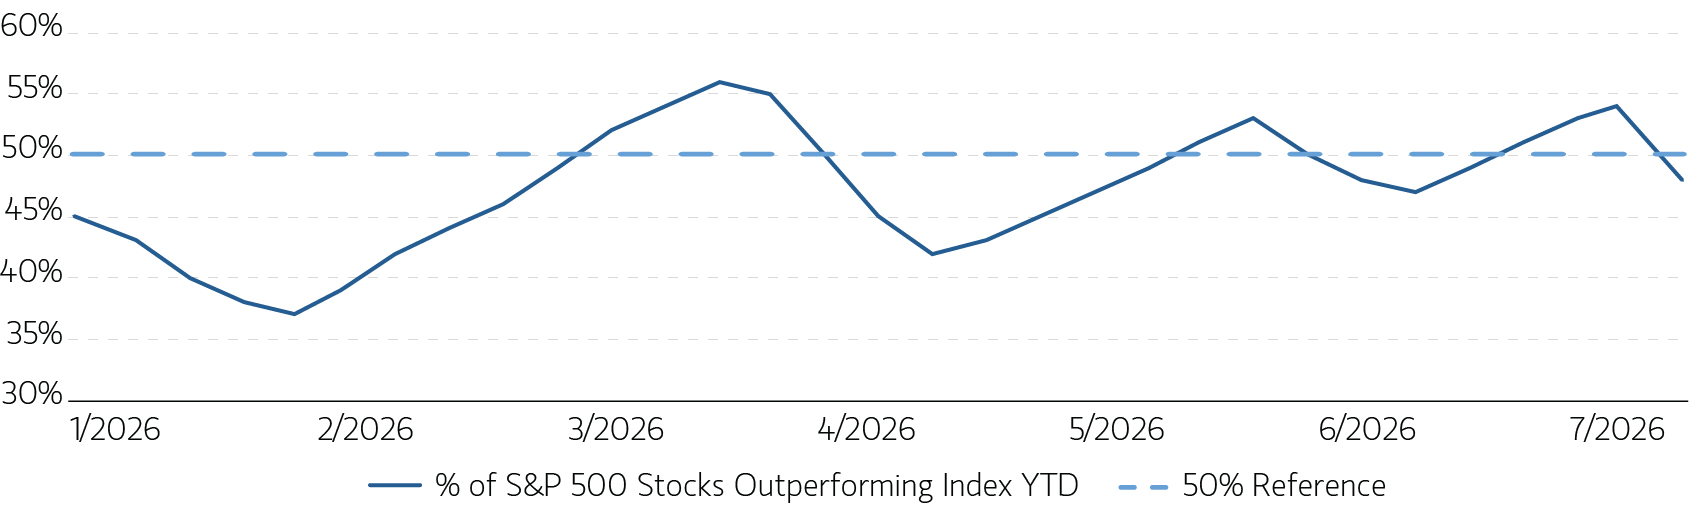
At the same time, earnings surprises among other index constituents have given investors greater reason to rotate into smaller and more value-oriented issues, bringing greater breadth to the market’s advance. That rotation ushered in what is being called a “breadth thaw.”
As the chart below shows, market participation has broadened significantly since February 2026. No longer moving in lockstep, the Mag-7 are at their weakest relative levels since last summer. A more broadly driven market has helped push year-to-date returns into double digits for both the market cap-weighted and equal-weighted S&P 500®.
S&P 500® Market Breadth (1/2/2026–7/31/2026)
Source: LSEG, S&P Global, as of July 31, 2026. For illustrative purposes only. Not a recommendation to buy or sell any security. It is not possible to invest directly in an index. Indexes are unmanaged and do not reflect the deduction of fees or expenses. Past performance is not indicative of future results. All investments are subject to risk, including the risk of loss.
Opportunities abound to reduce taxes, regardless of market conditions
Enter dispersion
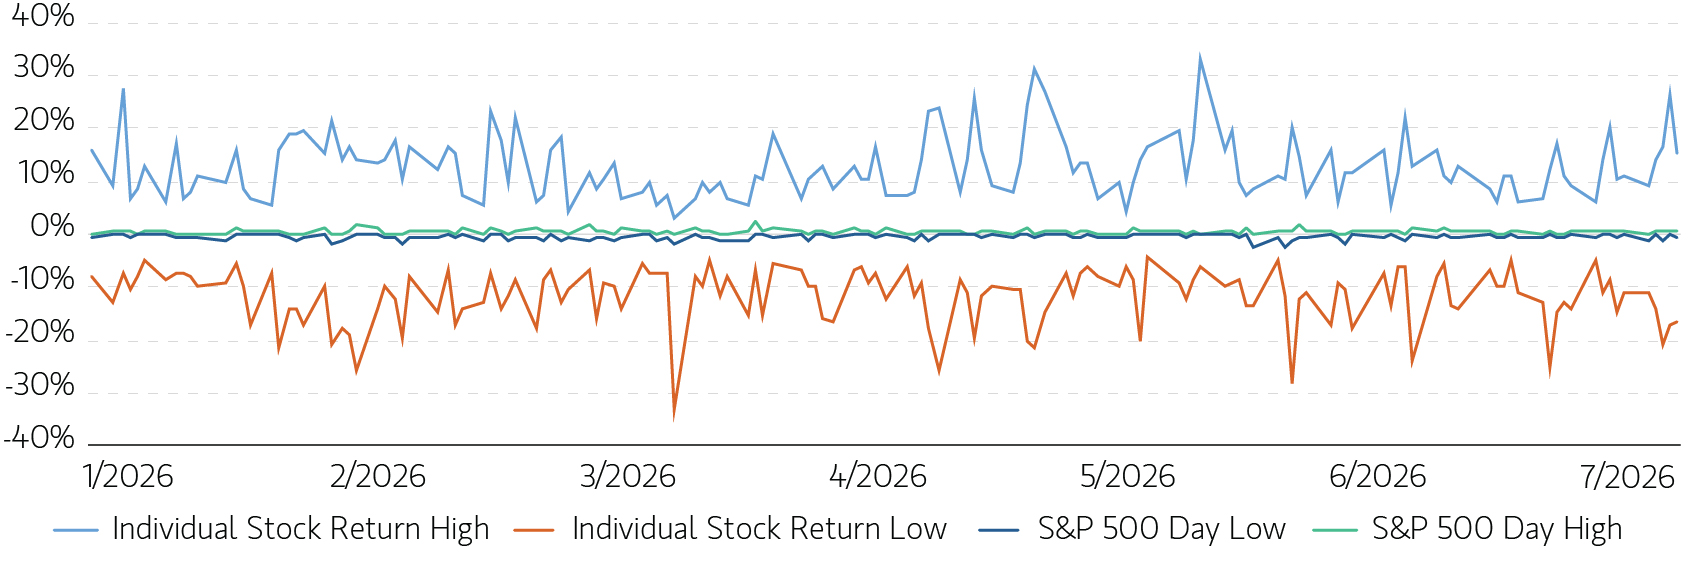
Along with the thaw, however, dispersion between gaining and losing stocks has reached historically high levels. That divergence is particularly striking given the S&P 500’s remarkably narrow trading range. According to the London Stock Exchange (LSEG), individual stock dispersion remained elevated from January 2 through July 31, 2026, even as the index itself moved within its tightest range since the 1960s.
In February, single-stock volatility was nearly seven times index volatility—the widest gap in at least 30 years, according to Barclay’s.1
Individual Stock Dispersion versus S&P 500® Trading Range (1/2/2026–7/31/2026)
Source: LSEG, S&P Global, as of July 31, 2026. For illustrative purposes only. Not a recommendation to buy or sell any security. It is not possible to invest directly in an index. Indexes are unmanaged and do not reflect the deduction of fees or expenses. Past performance is not indicative of future results. All investments are subject to risk, including the risk of loss.
The CBOE DSPX Index provides another measure of this trend. It captures expected dispersion among individual stocks over the next 30 days and rose from about 30 at the start of 2026 to an all-time high above 47 by mid-July. The move underscores the unusually wide performance differences within the S&P 500®.
How concentration and dispersion shape direct indexing
Direct indexing has two primary objectives: closely tracking an index and creating opportunities for tax management. Tracking the index requires maintaining exposure to its largest holdings, regardless of whether they are currently driving market performance. When they do lead the market, the portfolio can participate in their gains while potentially harvesting losses elsewhere. When these top holdings retreat, their declines may themselves create additional harvesting opportunities.
High dispersion can further enhance those opportunities. When market gains are broadly distributed but performance varies widely among individual stocks, deeper declines among the laggards can increase the amount of loss realized per trade. Both conditions are present today. The S&P 500® continues to advance despite its narrow trading range, while elevated stock-level volatility has created ample opportunities for tax-loss harvesting.
Putting tax-loss harvesting into practice
Results from the first half of 2026 illustrate how elevated stock-level dispersion can support tax-loss harvesting, even as major benchmarks advance. Parametric’s systematic approach harvested nearly $3.5 billion in losses across more than 350,000 trades in the second quarter, representing a potential tax benefit of more than $1.3 billion for Custom Core investors. Through the first half of the year, Parametric harvested more than $7.4 billion in losses firmwide, representing a potential tax benefit of more than $2.8 billion.2
These results demonstrate how headline index returns can mask meaningful opportunities beneath the surface: Rising markets and elevated stock-level dispersion can allow systematic tax management to generate substantial harvesting activity.
The bottom line
The structural concentration built up through 2024 and 2025 has not disappeared even as market breadth has widened. Instead, the S&P 500® continues to grind higher within a narrow range, even as historically high dispersion widens the gap between individual stock gainers and decliners. This unusual combination—a rising index alongside significant security-level losses—is at the heart of the current opportunity for direct indexing. It potentially creates greater scope for tax-loss harvesting while retaining exposure to the stocks driving index performance.
1 Bloomberg, “Listless US Stock Market Masks Record Volatility Beneath Surface,” February 20, 2026.
2 Source: Parametric, 12/31/2025. The information is provided for illustrative purposes only. Values are aggregated across all direct indexing strategies. Only client positions with unverified cost basis were excluded from calculations. Loss calculation is based on the amortized book price minus the sell price, represents historical information and should not be construed as future results. Loss information illustrates the effect to a portfolio and is not representative of, and should not be construed as, performance. There is no assurance that tax loss harvesting will continue in the future. There is no guarantee that any specific account may engage in tax loss harvesting.
Past performance is no guarantee of future results. The returns referred to in the blog are those of representative indexes and are not meant to depict the performance of a specific investment.
Parametric and Morgan Stanley do not provide legal, tax, or accounting advice or services. Clients should consult with their own tax or legal advisor prior to entering into any transaction or strategy described herein.
The views expressed in these posts are those of the authors and are current only through the date stated. These views are subject to change at any time based upon market or other conditions, and Parametric and its affiliates disclaim any responsibility to update such views. These views may not be relied upon as investment advice and, because investment decisions for Parametric are based on many factors, may not be relied upon as an indication of trading intent on behalf of any Parametric strategy. The discussion herein is general in nature and is provided for informational purposes only. There is no guarantee as to its accuracy or completeness. Past performance is no guarantee of future results. All investments are subject to the risk of loss. Prospective investors should consult with a tax or legal advisor before making any investment decision. Please refer to the Disclosure page on our website for important information about investments and risks.
Investment strategies that seek to enhance after-tax performance may be unable to fully realize strategic gains or harvest losses due to various factors. Market conditions may limit the ability to generate tax losses. Tax-loss harvesting involves the risks that the new investment could perform worse than the original investment and that transaction costs could offset the tax benefit. Also, a tax-managed strategy may cause a client portfolio to hold a security in order to achieve more favorable tax treatment or to sell a security in order to create tax losses.
09.30.2027 | RO 5907089