

Monetary policymakers have been battling inflation aggressively for years. Yet reaching their target remains elusive, which argues for maintaining an allocation to a broad basket of commodities.
The US Federal Reserve appears to be in the final round of its fight against inflation. Domestic prices rose just 3.1% year over year in January 2024, down from a peak of 9.1% in June 2022. We would call that spectacular progress—especially when GDP growth continues to outpace economist expectations, suggesting that people haven’t shied away from spending.
Yet we see reasons to believe that the last hurdle for the Fed to overcome—getting inflation back to its 2% target—could be the most difficult. Inflation in the services sector hasn’t fallen nearly enough, and a robust labor market may make that even more challenging.
The Fed may still begin cutting interest rates this year, at least to maintain a more neutral policy stance given the inflation progress already made. If so, many pundits have pointed to gold as a likely benefactor, claiming that prices would surely rise as the opportunity cost of owning gold falls.
We see little historical evidence for this claim, however. And we find it more concerning that gold prices failed to rally as recently as 2022, even though inflation was significantly higher than expected.
Low-hanging fruit already picked
Easing external price pressures have been the driving force behind falling inflation. Following Russia’s invasion of Ukraine two years ago, food and energy shocks hit Europe. Since then, energy and food price increases in the eurozone have significantly abated. While more insulated from the Russia-Ukraine conflict, the US faced supply chain disruptions that lingered from the pandemic. Now those strains have also lessened.
With the effects of earlier price shocks fading, the low-hanging fruit on the road to the 2% target may have already been picked. We can see that plainly in the breakdown of goods versus services inflation.
Year-over-year PCE inflation in services and goods
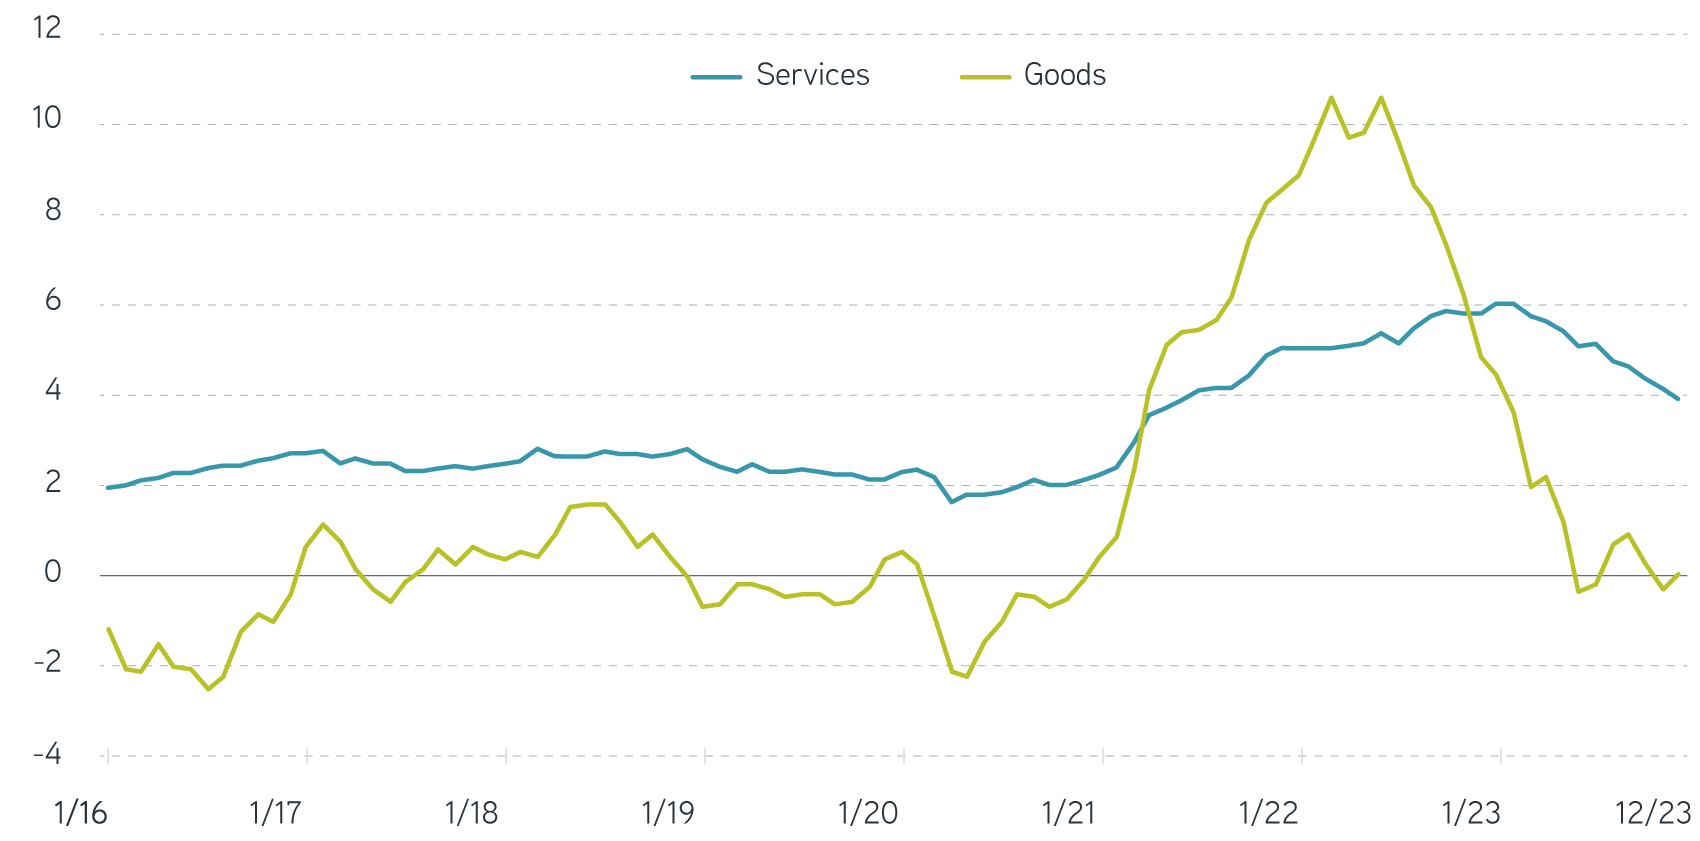
Source: US Bureau of Economic Analysis, retrieved from FRED, Federal Reserve Bank of St. Louis, Parametric. As of 2/13/2024.
Year-over-year goods inflation fell to roughly zero from a peak over 10% in 2022, while inflation on the services side was 3.9% year over year in December 2023. Services inflation is still significantly above the pre-pandemic average of about 2%. That’s a key reason the Fed needs to see more data before it can feel confident that inflation is under control.
Certainly, the overall trend appears favorable, but one area where the Fed hasn’t made enough progress is cooling off a sizzling labor market. Until very recently, employers wanted to hire more workers than they could find, resulting in a surge in vacancies. For every unemployed person, 1.4 jobs were available at the end of 2023. At its peak in 2022, there were over two vacancies per person in need of a gig.
US labor demand and supply
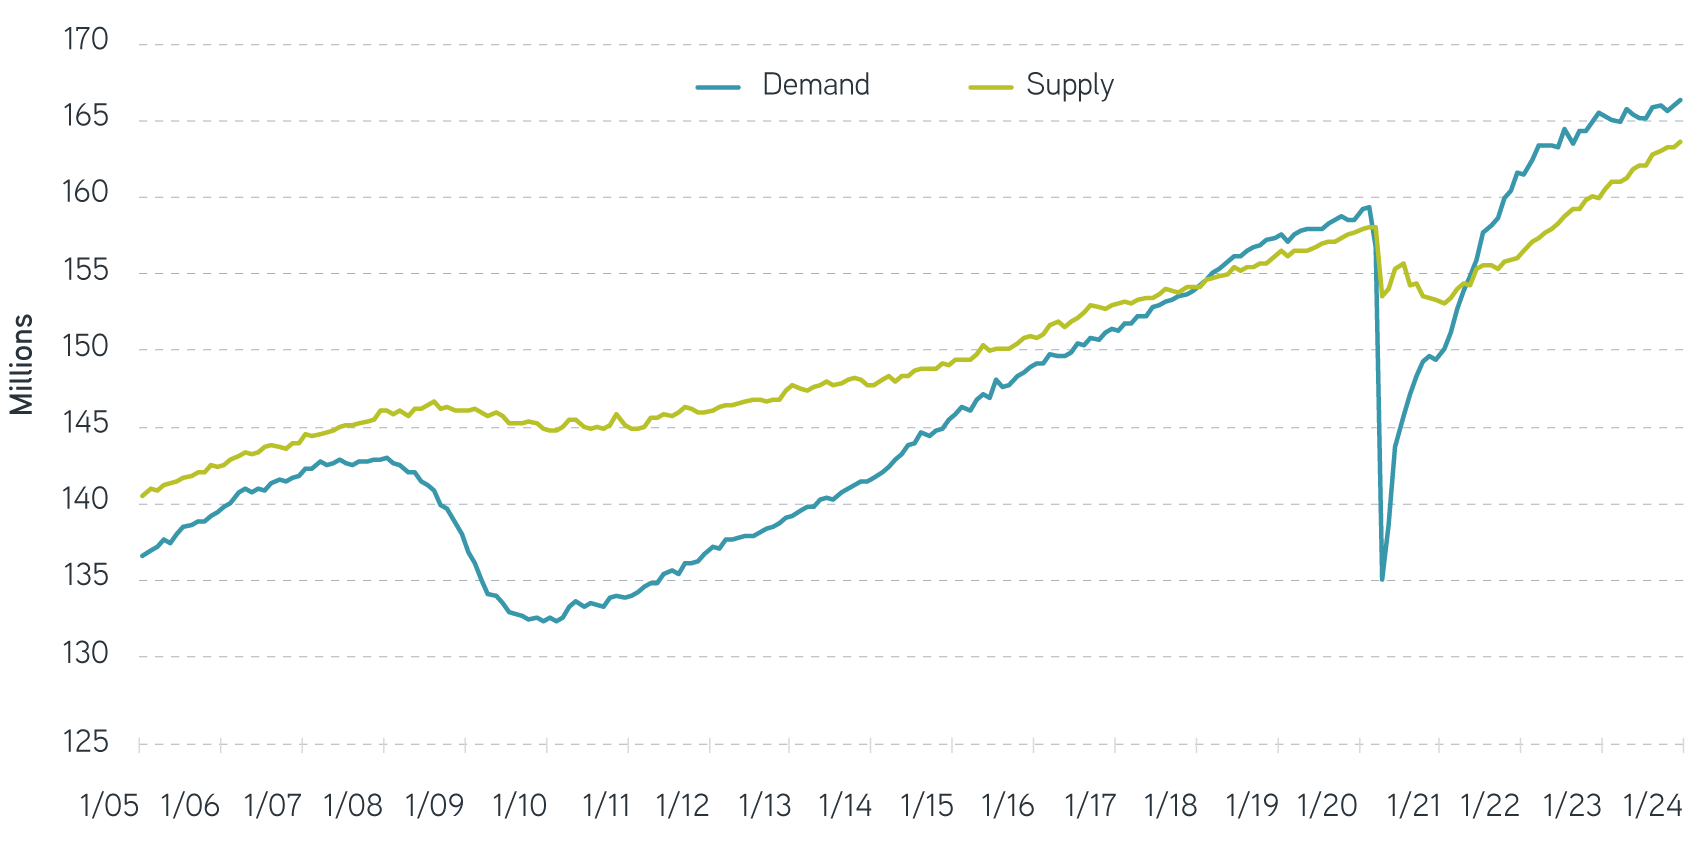
Note: Demand is the sum of total nonfarm payrolls and job openings, seasonally adjusted. Supply is the sum of total nonfarm payrolls and the unemployment level, seasonally adjusted.
Source: US Bureau of Labor Statistics, retrieved from FRED, Federal Reserve Bank of St. Louis, Parametric. As of 2/13/2024.
Swimming in options, employees asked for big raises, and year-over-year wage growth topped 6%—more than twice the average over the decade before the pandemic. That drove up company costs, which were often passed along to consumers in the form of higher prices.
To get inflation fully under control, we probably need to see an easing in wage growth. Given long-term trends in productivity gains, Fed Chair Jerome Powell has suggested that 3% wage inflation would be consistent with their inflation target over the long run.1
This is all part of the Fed’s plan in raising rates. They hope that by hiking interest rates, higher borrowing costs will cause demand for labor to fall and with it, wage inflation. So far, the plan seems to be working. Using the data in the chart above, we estimate that labor demand now sits just 1.7% above labor supply, down from 3.8%.
Wage inflation, on the other hand, has made less progress. In January, average hourly earnings sat 4.5% higher than the year prior—probably still too high to hit the Fed’s 2% target. It’s worth remembering that for most workers, pay changes occur only once a year, so there may be a lag before lower demand for labor makes its way into wages. This suggests that the last stretch of getting inflation back to target may yet take some time.
Risk-management solutions for uncertain markets
Not all that glitters
Inflation’s trajectory can make an interesting backdrop for commodity investors. If all goes to plan, the Fed could cut interest rates three times by year's end. In this type of environment, we often see gold touted as a potential beneficiary. Ownership of the metal comes with no monetizable benefits, such as coupons or dividends, just the hope or expectation that its price may go up. One theorized way to make that happen is by lowering the opportunity cost of ownership—that is, interest rates.
Historically, gold has demonstrated little relationship with changes in interest rates. Since 1955, the yearly percentage change in gold prices had a correlation of 0.28 with the change in the federal funds rate. Such a low statistical measure of co-movement suggests that the odds of a fall in rates coinciding with a rally in gold have been less than the even chance of getting heads when flipping a coin.
Annual change in gold prices and fed funds rate, 1955 – 2023
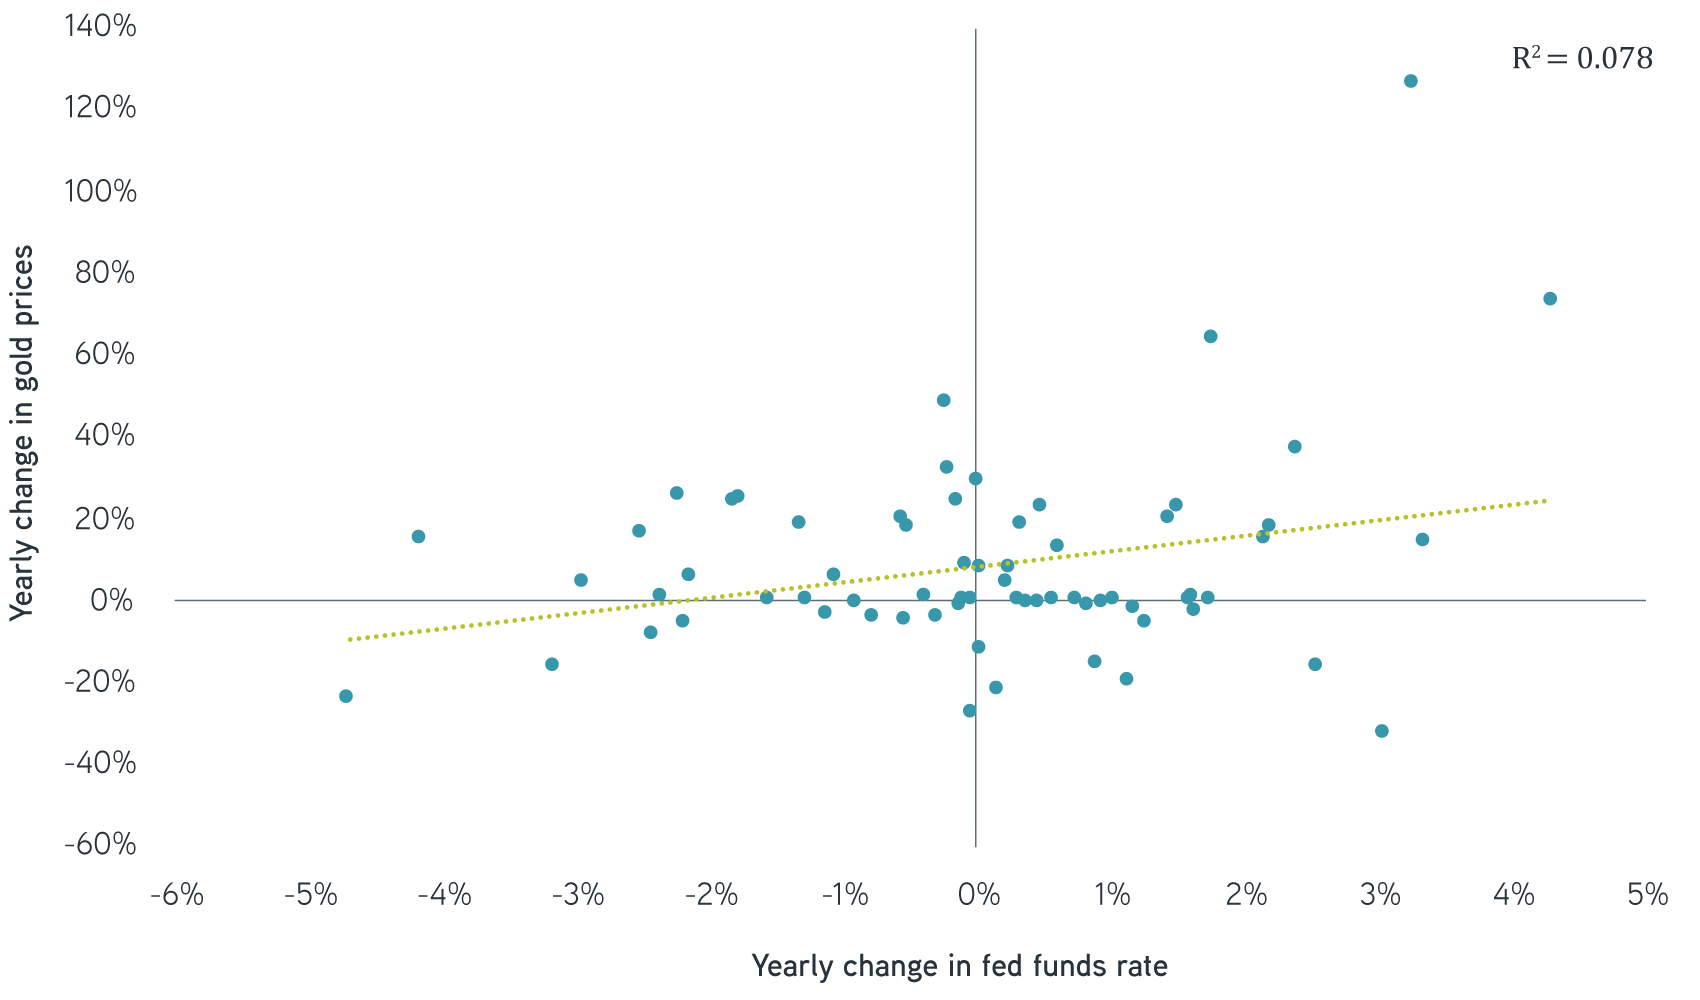
Note: Coefficient of determination R² denotes the proportion of the variation in the dependent variable (here, change in gold prices) that is predictable from the independent variable (here, change in fed funds rate).
Source: Federal Reserve Bank of New York, LBMA Gold Price PM (Ice.com), Bloomberg, Parametric. As of 2/14/2024.
For illustrative purposes. Not a recommendation to buy or sell any security. Past performance is not indicative of future results. All investments are subject to risks, including the risk of loss.
Perhaps more troubling has been the inconsistent track record of gold as an inflation hedge. At times it has rallied in concert with a pickup in inflation, as it did during the great inflationary outbreak of the 1970s and early 1980s. Annualized Consumer Price Index (CPI) inflation from 1972 to 1983 was 7.8%, while gold prices averaged a yearly gain of 19.8%.
More recently, though, gold has lacked that connection. Annualized CPI inflation was 5.6% for the three years ending in 2023, compared to a yearly average return of only 3.3% from gold. Worse still, gold prices were actually down throughout most of 2022, at the peak of this inflation cycle.
Taken together, we find it hard to see a strong case for piling into the metal now. Based on its historical behavior, we wouldn’t assume that a fall in rates will lead to gold price gains. Nor has gold been a slam dunk at preserving value during inflationary outbreaks.
Broad commodities brighter than gold
By contrast, the Bloomberg Commodity Index (BCOM) has historically delivered both better inflation protection and performance than gold. Over the past five years, we estimate that BCOM’s correlation with CPI inflation was 0.4, while its beta was 4.9.2 In other words, BCOM not only rallied when inflation erupted, but it generally increased five times the inflation rate. Gold, on the other hand, had a correlation of -0.3 with inflation and a beta of -2.1.
These stats match what most investors experienced firsthand in 2022, when BCOM was up 16.1% for the year, while gold fell 0.7%. The longer-term track record is similarly stacked in BCOM’s favor: Since 1960, BCOM has delivered an annualized return of 7.7% through January 2024, outperforming gold by nearly 1.5%.
The bottom line
Inflation in the US has likely peaked for this cycle, though the final stretch back to the Fed’s 2% target may not be as quick as we’d like to believe. That’s because labor demand—and therefore labor inflation—hasn’t come down quickly enough to get us there. We’re not suggesting that interest rates won’t fall this year, but if they do, we can’t count on gold to outperform the rest.
1 Board of Governors of the Federal Reserve System, Federal Open Market Committee, Press Conference, May 3, 2023.
2 Beta is a statistic that measures the expected increase or decrease of one variable (here, BCOM index or gold price) in proportion to movements of another variable (here, CPI inflation).
It is not possible to invest in an index. Past performance is no guarantee of future results.