

Index investors may find themselves worried about increasingly concentrated portfolios, limiting the benefits they seek. There are different ways to strike the right balance for investors who carefully consider their needs.
Index investing has been a boon to investors seeking accessible, diversified portfolios. However, many index-based portfolios have become notably more concentrated in recent years, in terms of both individual stock positions and sector representation. This concentration undermines one of the primary benefits of indexed investment solutions.
Given this reality, it’s understandable why many investors are seeking to build more diversified portfolios. Let’s look at some options and some things to be aware of when making that decision.
Are indexes more concentrated now?
Indexes commonly have hundreds of constituents, with some topping more than a thousand. In a fully diversified approach with that many holdings, constituent weights would typically be less than 1% and measured in basis points (bps). However, looking across some of the most commonly used indexes today, we frequently see constituent weights that are many multiples of that. For example, recent weights in Apple and Taiwan Semiconductors have reached 7% in the S&P 500® Index and the MSCI Emerging Markets (EM) Index, respectively.
This concentration also currently extends to sector and country. The technology sector verges on 20% to 30% of total weight in many indexes, and financials often dominate as well. (As a reminder, there are typically 11 sectors, which would imply a weight of around 9% in an equal-sector-weighted approach.) In geographically diverse indexes, it’s not uncommon to find that one or two out of dozens of countries make up a significant portion of an index, sometimes more than a quarter. For example, Japan makes up more than 20% of the MSCI EAFE Index, and China represents about 34% of the MSCI EM Index.
Readers who pay close attention to market history will know we aren’t necessarily witnessing the most extreme concentrations. As financial historians Elroy Dimson, Dr. Mike Staunton, and Paul Marsh point out in their long-term study of investment returns, railroad companies made up about 63% of the US stock market’s value in 1900. According to S&P 500® Dow Jones Factor Indices, the weight of the top five companies in the S&P 500® was around 28% in the 1960s. Work by the late John Bogle of Vanguard® in 2003 indicates this was down from 50% in the 1950s.
But it’s true that US and emerging markets are showing greater concentration at a security level than we’ve seen in decades. The five largest companies in the S&P 500® and Russell 1000® indexes currently make up 20% of the total weight of each. In the MSCI EM Index, the five largest companies made up as much as 27% of the total weight in the fall of 2020, although that stands at about 20% now. Interestingly, security-level concentration for developed markets outside the United States has stayed remarkably consistent over the past two decades and is much lower than for US and emerging markets. Less than 10% of the MSCI EAFE Index is currently in the five largest companies.
Weight in five largest stocks, 1978–present
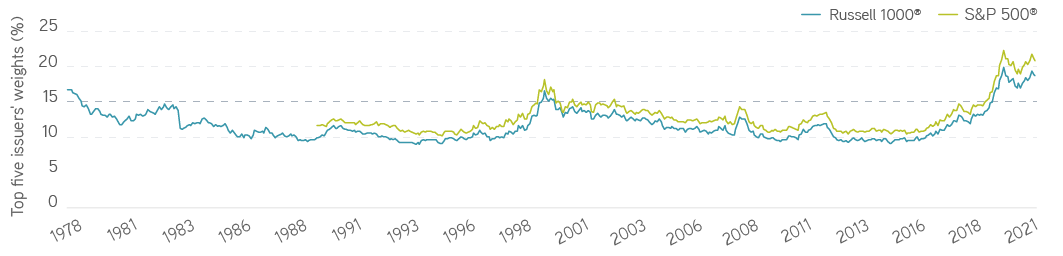
Sources: FTSE Russell, S&P Dow Jones Indices, and FactSet. For illustrative purposes. Not a recommendation to buy or sell any security. All investments are subject to risks, including the risk of loss.
Weight in five largest stocks, 2002–present
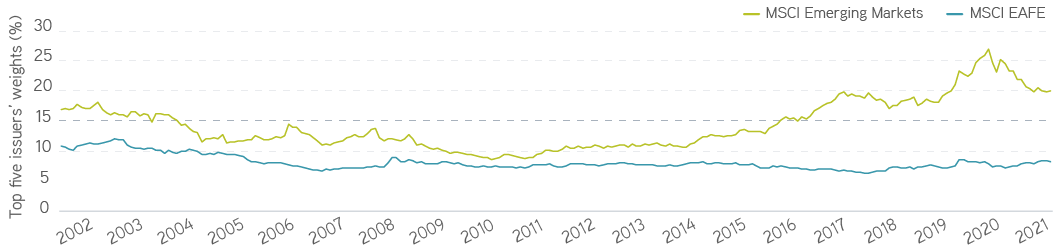
Sources: MSCI, FactSet. For illustrative purposes. Not a recommendation to buy or sell any security. All investments are subject to risks, including the risk of loss.
Make taxes less taxing
Even if this isn’t the most extreme period of concentration from a long-term historical perspective, investors are still concerned about its consequences. In particular, portfolios with large concentrations become increasingly exposed to the fortunes of a small number of companies, sectors, or countries, which undermines the value of diversification. After all, approximately one quarter of the S&P 500® return in 2021 came from the five largest companies, and nearly half of the MSCI EM Index’s 2020 return came from the five largest companies. The recent and still-unfolding tech sell-off highlights this risk from a sector perspective.
Investors seeking an alternative have a few different options to combat this. Equal-weighted indexes certainly offer a very direct solution to the problem of concentration. But some work only to combat concentrations at the security level, while others also address it at the sector level. In the S&P Dow Jones Indices, for example, constituents are simply equally weighted. In the S&P 500® Equal Weight Index, for example, each stock gets a weight of 1/500 of the index. This addresses concentration at the security level, but it won’t do anything to address concentration at the sector level. If the number of constituents in a particular sector increases, the weight in that sector will increase in proportion.
Currently, the S&P 500® Equal Weight Index does have a more even representation across sectors. The weight of information technology stocks is notably lower, and the weights of real estate, utilities, and materials are more than double that of the market-cap-weighted version, as shown in the chart below. Although not the case for the S&P 500® Equal Weight Index, there are some equally weighted indexes that also try to control explicitly for sector concentrations: In the Russell Equal Weight Index series, for example, sectors are weighted equally first, then constituents are equally weighted within each sector.
Sector weights by index
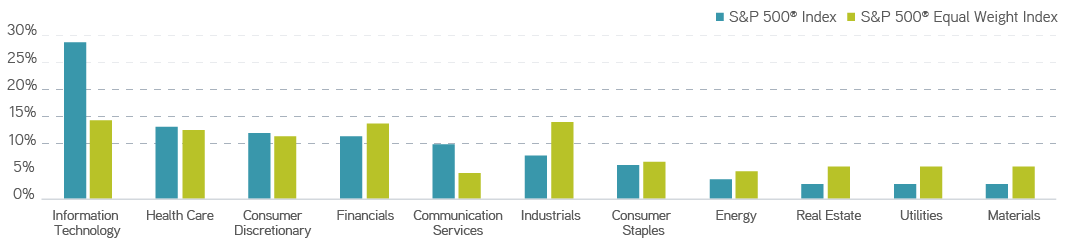
Source: S&P 500®. For illustrative purposes. Not a recommendation to buy or sell any security. All investments are subject to risks, including the risk of loss.
Alternative-weighted indexes use mechanisms other than market value to weight constituents. For example, the RAFI Fundamental Index series uses adjusted sales, cash flow, dividends and buybacks, book value, and intangibles to weight constituents. The larger these metrics, the larger the company’s weight. Of course these are also characteristics that influence a company’s stock price, so investors tend to find a similar cast of characters among the top holdings and at similar weights. For example, Apple is the largest holding in the RAFI Fundamental US Index at a weight of 5%.
One other option is diversified active strategies. In this approach, holdings tend to be more numerous, limiting security, sector, and geographic risk. The value in these kinds of strategies can come from both avoiding the kinds of concentrations that can plague market-cap–weighted indexes and using rebalancing to maintain diversification.
What should investors know before selecting an alternative?
There’s no universal right response to index concentrations, but there are two things investors should bear in mind before proceeding. The first is their tolerance for performance deviations against a market-cap-weighted index, and the second is their tax sensitivity.
Although the intent of selecting a non-market-cap-weighted portfolio is to perform differently from the benchmark, investors should be sure they’re prepared for that on both sides. More diversified portfolios tend to underperform when companies dominating the market cap benchmark do well. Of course, the reverse could be true when those companies underperform. The return differences can be hard to stomach for investors more sensitive to tracking error, particularly if there are multiyear periods of underperformance. The following chart compares the calendar-year performance for the S&P 500® Equal Weight Index and the S&P 500® Index for illustration purposes.
Annual returns, 1990–present
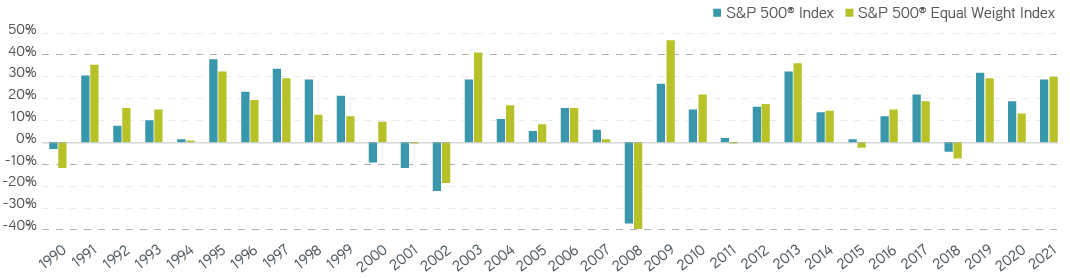
Source: S&P 500®. For illustrative purposes. Not a recommendation to buy or sell any security. All investments are subject to risks, including the risk of loss.
On the tax front, strictly equal-weighted portfolios with more frequent rebalancing tend to have higher turnover. For investors using separately managed accounts to invest in equally weighted indexes, the increased turnover can lead to tax drag to maintain equal weighting. Although tax drag can be reduced by allowing the portfolio to drift, that can come at the expense of dissipating some of the concentrations in the portfolio.
The bottom line
Investors worried about index concentration have a number of diversification alternatives available to them. When considering equal-weighted indexes, alternative weighted indexes, or other diversification strategies, investors need to balance their tolerance for performance deviations and their tax sensitivity. The right balance can deliver the accessible, diversified index-based portfolios investors feel is right for them.
S&P Dow Jones Indices are a product of S&P Dow Jones Indices LLC (“S&P DJI”) and have been licensed for use. S&P® and S&P 500® are registered trademarks of S&P DJI; Dow Jones® is a registered trademark of Dow Jones Trademark Holdings LLC (“Dow Jones”); S&P DJI, Dow Jones, and their respective affiliates do not sponsor, endorse, sell, or promote the strategy(s) described herein, will not have any liability with respect thereto, and do not have any liability for any errors, omissions, or interruptions of the S&P Dow Jones Indices.
“MSCI” and MSCI Index names are service marks of MSCI Inc. (“MSCI”) or its affiliates. The strategy is not sponsored, guaranteed, or endorsed by MSCI or its affiliates. MSCI makes no warranty nor bears any liability as to the results to be obtained by any person or any entity from the use of any such MSCI Index or any data included therein. Please refer to the specific service provider’s website for complete details on all indexes.