

Current market conditions may remind municipal bond investors of similar conditions in the past. Those similarities may not be enough to make the response obvious.
Experience is often our best teacher—but, as many of us were reminded during the COVID-19 pandemic, when our experiences are limited, drawing on them for a course of action can be problematic. Faced with renewed geopolitical conflict and resurgent inflation, investors today are trying to determine the appropriate way to respond to rare challenges.
For municipal investors, the market is in the midst of a historic sell-off. Since the beginning of the year, AAA benchmark yields are up over 100 basis points (bps) in the 10-year maturity and along most of the yield curve. In the past decade, we’ve had three instances where yields have risen that far that fast: during the 2013 taper tantrum, following the 2016 election of Donald Trump, and during the pandemic-induced recession of 2020.
The move in yields didn’t cap out at 100 bps in these instances. However, we think this round number is an acceptable threshold for a trigger point. We note that in all three instances, six months from the day the 10-year AAA benchmark first recorded a 90-day, 100-bps rise, the market had rebounded and yields were notably lower. The six-month rebound was 39 bps in 2013, 50 bps in 2016, and 195 basis points in 2020.
Historical rises in the 10-year AAA municipal yield benchmark
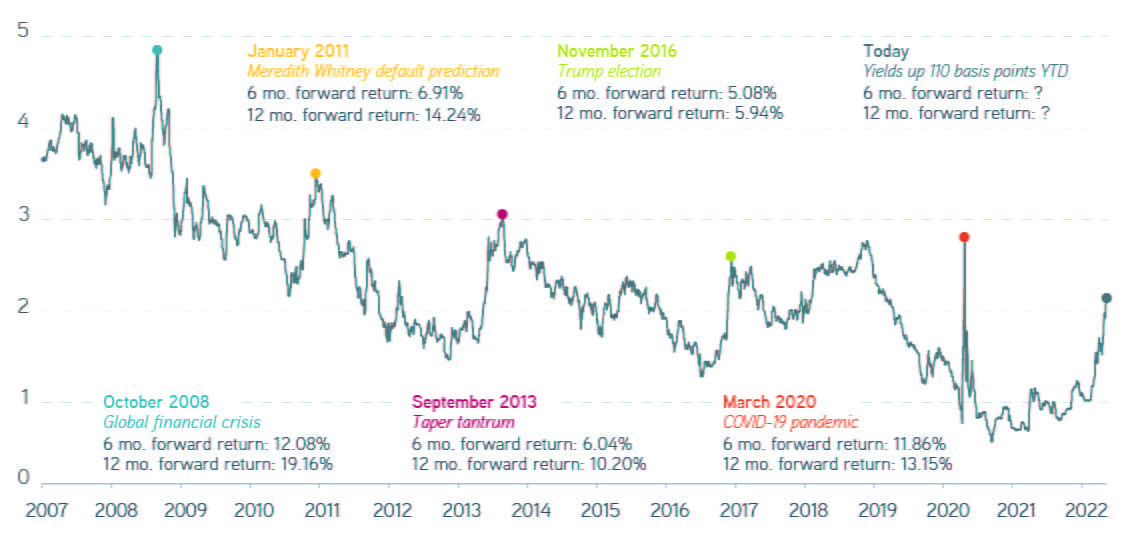
Source: Thomson Reuters Municipal Market Data, 3/1/2022. For illustrative purposes only. Not a recommendation to buy or sell any security.
Based on the experience of the past decade, current market yields could potentially offer an attractive entry point. With high equity valuations, a flattening Treasury curve, and aggressive posturing from the Federal Reserve, it’s possible to envision an outcome where municipal bond market performance follows that historical pattern. But it’s also possible to paint a less optimistic picture. One of the key differences between today’s yield hike and the three before it is the presence and persistence of elevated inflation. Periods of persistent, elevated inflation have been quite rare. Using quarterly consumer price index (CPI) data as a barometer and looking back half a century to 1972, the average year-on-year change has been 3.9%.
We count four instances where the annualized change in CPI reached 5%. (For our purposes, we define an instance as beginning when the annualized change hits 5% and ending when it returns to the average of 3.9%.) Markets saw an extended inflationary period that began in 1973, a shorter burst of inflation beginning in 1989, a brief reoccurrence in 2008, and the current instance that began in Q2 2021. Given investors’ limited experience with inflation, using past experience as a guide may not be appropriate.
Quarterly change in the consumer price index (CPI)
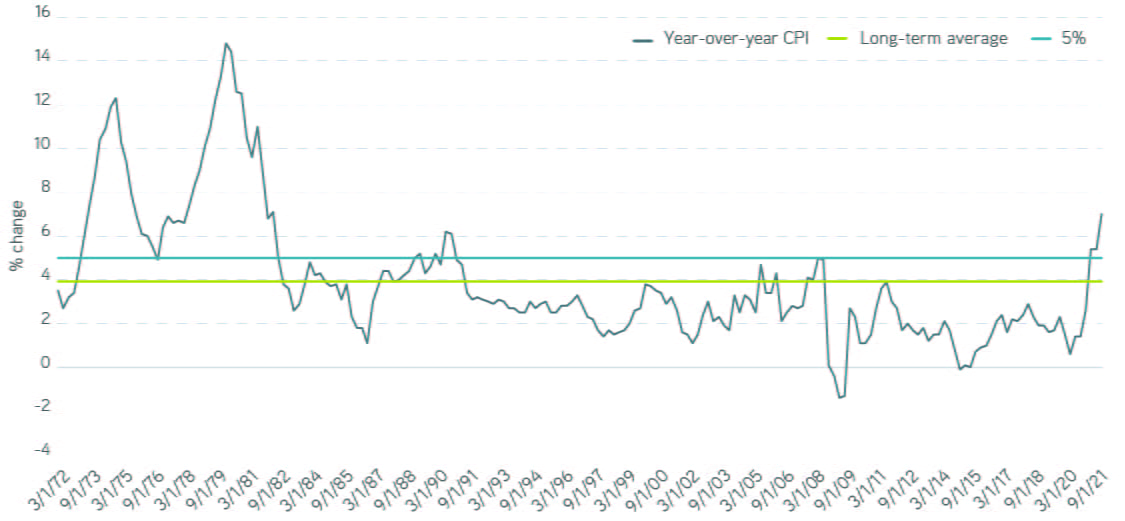
Source: Bloomberg, 3/1/2022. For illustrative purposes only. Not a recommendation to buy or sell any security.
We offer tax-advantaged core bond market exposure
The comparison observers most frequently draw is between today and 1973. This is understandable, since 1973’s inflation was both significant and sustained, likely creating a visceral memory for investors who experienced it firsthand. On the surface we could draw a parallel between then and now—an oil shock hitting just as the global economy experiences rising inflation—but the parallel really doesn’t hold up to scrutiny.
First, the oil shock from the 1973 OPEC oil embargo was meaningful. According to data from Bloomberg, crude oil went from $3.07 per barrel to $11.65 per barrel, an increase of 379% ($19.62 per barrel and $74.44 per barrel, respectively, in today’s dollars). The average per-barrel price of oil for the 12 months preceding the war in Ukraine was $73.24, and it’s hovering around $105.96 today. That 45% increase pales in comparison to what occurred in 1973.
Second, the nature of the economy is vastly different than it was in 1973. The demographic change is especially striking, with the median age roughly a decade higher today. Individuals over 65 were around 10% of the population then and are over 16% now. According to the US Department of Labor, close to 25% of the US workforce belonged to a union in 1973, and less than 11% does today. The 1970s saw the value of the greenback fall by one third, but its value in the 2020s is virtually unchanged. All these factors should temper inflation: As an aging population consumes less, fewer blanket automatic cost-of-living increases will be negotiated, and a stable currency will keep imports in line with global trends.
Finally, our understanding of the impact of economic policy has advanced. President Richard Nixon was instituting wage and price controls in 1971, when using monetary policy to contain inflation was a largely untested theory. Today most investors are confident that the Fed has the correct and necessary tools to tame inflation.
We see today as neither 2013 nor 1973. We think the Fed will act decisively through a combination of quantitative tightening and interest rate increases to contain today’s inflation. We believe the current elevated rate of annual CPI inflation won’t be sustained. Most importantly, we expect inflation to be lower by the end of the year, possibly even below the long-term average of 3.9%.
This is the Fed’s view as well. The forecast of Personal Consumption Expenditure (PCE) inflation—the Fed’s preferred measure of inflation—is 4.3% for the full year of 2022, declining to 2.7% in 2023 and 2.3% in 2024. We interpret the rapid flattening of the Treasury yield curve as an indication that market participants also believe that inflationary expectation won’t settle anywhere close to the current annualized rate.
We expect municipal yields to have an upward bias, at least until the data demonstrates a clear reversal of the current CPI trend. For investors who have been rattled by the ferocity of the current move, we suggest staying the course, since the worst is likely over. Reinvestment at higher yields will reduce the impact over time of recent price action on their portfolios.
While we think the bulk of the move is likely behind us, the municipal market can and does at times overreact. Any acceleration in the pace of outflows that results in a fresh sell-off from current yields could represent an attractive entry point. The experience of March 2020, when the municipal market experienced dramatic V-shaped price action in a matter of weeks, comes to mind..
Absent that opportunity, rising yields could be headwinds, but we think investors looking for tax-free income can put cash to work in municipals today. We recommend opting for defensive strategies such as laddering, tax-loss harvesting, and using active managers with demonstrable track records of outperformance in a rising rate environment.