

Early 2022 has seen a volatile stock market. Inflation, the invasion of Ukraine, and the first Fed fund rate increase since 2018 are only some of the impactful events of the first quarter. Such volatility creates an opportunity to harvest tax losses, but the need for risk control increases as well.
During periods of extreme volatility, balancing tax-loss harvesting and risk becomes even more important. Sharp market downturns present the greatest opportunity for tax-loss harvesting, since these are the periods when both the breadth and depth of losses are the largest. However, the worst-performing stocks during a stock market crash also tend to be some of the best-performing stocks during its recovery. Although aggressively harvesting the worst beaten-down losses during a crash may look attractive from a tax perspective, this can lead to reversal risk of pretax underperformance when the market bounces back. Following the COVID-19 crash of 2020, our research team began to study whether there was a more effective way to trade in times of extreme volatility.
Reversal risk
Parametric has been providing tax-managed SMAs for 30 years. In that time, we’ve seen multiple stock market crashes, including the dot-com bubble of 2000 to 2002 ultimately bursting, the global financial crisis of 2007 to 2009, and most recently the COVID-19 crash of 2020. The chart below highlights the potential reversal risk during the global financial crisis. We’ve grouped the S&P 500® into five performance buckets based on returns during the 12 months before the March 9, 2009, market bottom.
S&P 500® market returns, 2008–2009
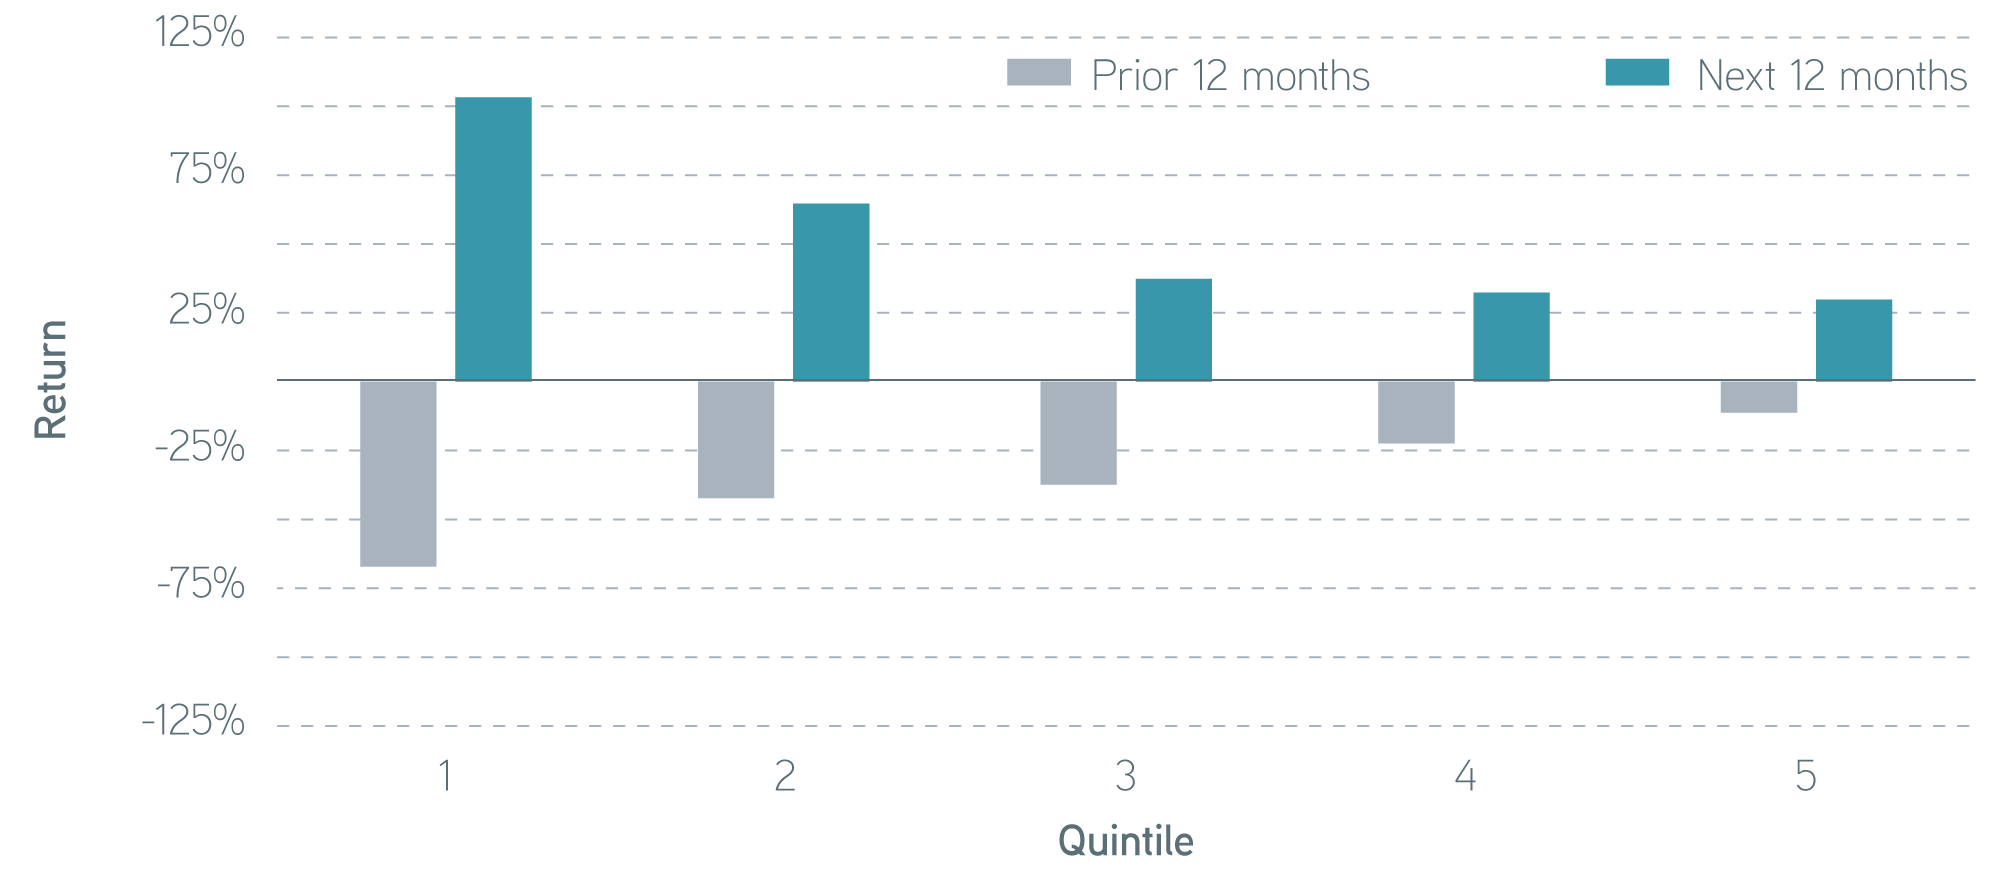
Source: S&P 500®, 2009. For illustrative purposes only. Not a recommendation to buy or sell any security.
As expected, the worst-performing stocks during the crash tended to perform best during the post-crash recovery. In a tax-managed SMA, we typically sell the hardest-hit positions while purchasing and holding the positions that have performed better in a stock market crash. This can lead to an underweight in the worst performers and an overweight in positions that fared better, creating a reversal risk as the stock market recovers.
What the research shows
In our research, we identified three factors associated with reversal risk: beta, momentum, and short-term reversal. The first two factors—beta and momentum—have always been in our risk model, but short-term reversal is a trading factor we developed in house. Short-term reversal explicitly monitors the returns of stocks over the prior month and controls exposure to this factor when loss harvesting moderates trading in names experiencing the most recent severe losses.
Find the right balance with Parametric tax management
Reversal exposures in S&P 500® quintiles, March 2009
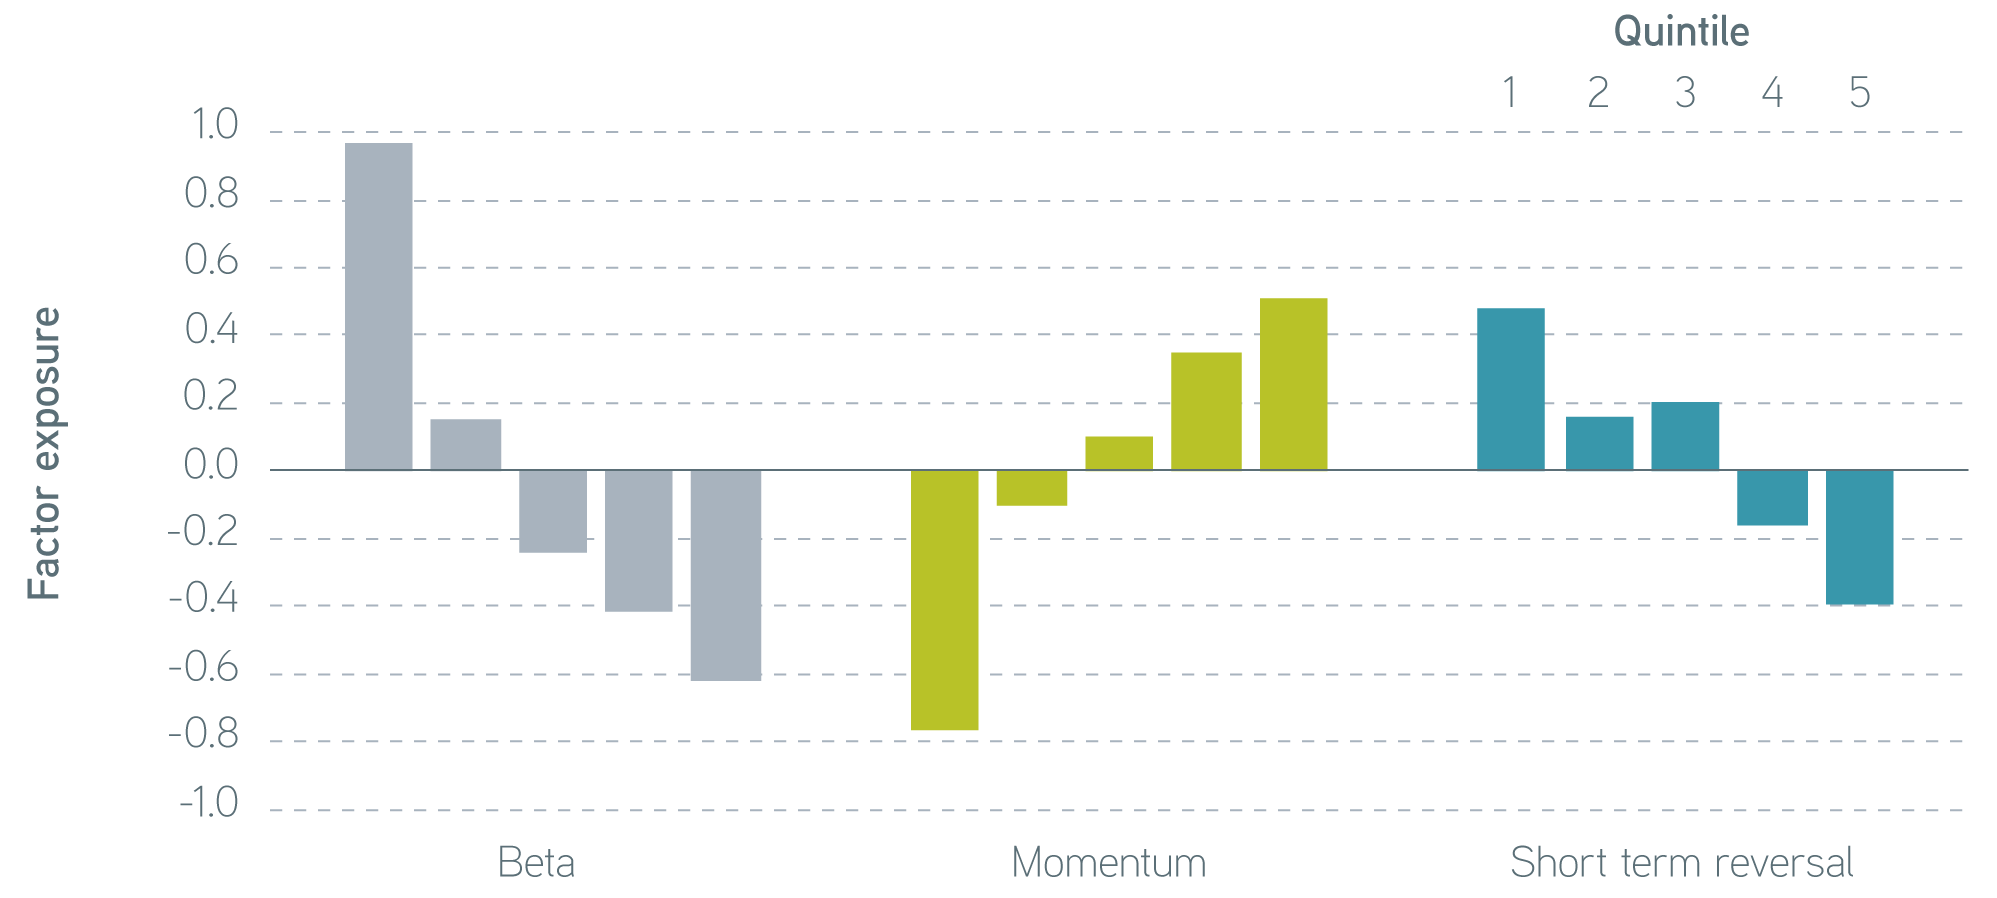
Sources: MSCI Barra and Parametric, March 2009. For illustrative purposes only. Not a recommendation to buy or sell any security. Equally weighted performance quintiles are based on the previous 12 months of individual stocks’ returns (March 2008–February 2009). Performance quintiles for short-term reversal exposures are based on the previous month’s individual stock total returns.
Importance of our research
Parametric has always been cognizant of the reversal risk following stock market crashes. Historically, our approach to managing this risk has been to intervene, tightening risk controls across the board during periods of extreme market volatility, then resuming a standard posture once volatility subsides. The main challenges with interventions are that broad-based tightening of risk management reduces portfolio manager latitude to capture available tax alpha, along with the uncertainty of market timing during the volatility of a crisis.
We can best address these challenges by tightly managing exposure to beta, momentum, and short-term reversal. First, this more targeted approach puts fewer constraints on portfolio managers wanting to harvest losses than a broad-based tightening of risk controls. Second, we can apply reversal-risk factor controls to loss-harvesting trades regardless of the level of market volatility, which removes the need to time a risk-control intervention.
Through extensive testing using our after-tax simulation tool, we’ve performed side-by-side comparisons of post-crash performance of accounts managed with and without targeting the three key reversal risk factors. The accounts managed using the targeted approach have better post-crash performance. Moreover, they do so without sacrificing tax alpha, without higher tracking error, and without greater turnover.
The bottom line
In Parametric’s 30-year history with tax-managed SMAs, we’ve seen many stock market crashes. Our focus has always been on the balance between delivering tax alpha and maintaining market exposure that aligns with the benchmark. In periods of extreme volatility, this balancing act becomes even more important given the reversal risk. The implementation of the short-term reversal factor, along with tightened constraints around momentum and beta, should allow our portfolio managers to more effectively manage this risk.
Test your knowledge of tax-loss harvesting with our interactive quiz. Some of the answers might surprise you, and that’s OK; they might surprise many in the industry who are new to tax-loss harvesting or aren’t fully sure how it works. We believe that, armed with more knowledge, we can all make the right decisions for clients—decisions based not on lore but on good, sound investment science.
S&P Dow Jones Indices are a product of S&P Dow Jones Indices LLC (“S&P DJI”) and have been licensed for use. S&P® and S&P 500® are registered trademarks of S&P DJI; Dow Jones® is a registered trademark of Dow Jones Trademark Holdings LLC (“Dow Jones”); S&P DJI, Dow Jones, and their respective affiliates do not sponsor, endorse, sell, or promote the strategies described herein, will not have any liability with respect thereto, and do not have any liability for any errors, omissions, or interruptions of the S&P Dow Jones Indices.
Question
Harvesting losses effectively means doing it continuously—all year round and not just at the end of the year, by which time key opportunities may have already been missed.
Harvesting losses effectively means doing it continuously—all year round and not just at the end of the year, by which time key opportunities may have already been missed.
Question
Over time, especially under the bull-market conditions we’ve experienced over the past 10 years, every position in a portfolio may have already been loss-harvested or be well above its cost basis—this is known as portfolio lockup. But that may take 10 years or more to happen. In the meantime you could have helped your clients extract a good deal of value from their losses. And don’t forget gain deferral, charitable gifting, and other ways to continue to reduce even older portfolios’ tax liability.
Over time, especially under the bull-market conditions we’ve experienced over the past 10 years, every position in a portfolio may have already been loss-harvested or be well above its cost basis—this is known as portfolio lockup. But that may take 10 years or more to happen. In the meantime you could have helped your clients extract a good deal of value from their losses. And don’t forget gain deferral, charitable gifting, and other ways to continue to reduce even older portfolios’ tax liability.
Question
You can sell a security at a loss, then immediately purchase a set of similar securities that, from a risk perspective, match the security you sold. You just have to make sure you don’t buy back the same security within 30 days.
You can sell a security at a loss, then immediately purchase a set of similar securities that, from a risk perspective, match the security you sold. You just have to make sure you don’t buy back the same security within 30 days.
Question
You can harvest a loss in an ETF or mutual fund only if the entire fund’s value falls below its cost basis. And due to the fund structure, excess losses harvested by the fund manager can’t be passed through to the investor and must be used to offset gains within the fund. Whereas with an SMA, the investor owns the individual underlying securities, unlocking the loss-harvesting potential of each individual stock.
You can harvest a loss in an ETF or mutual fund only if the entire fund’s value falls below its cost basis. And due to the fund structure, excess losses harvested by the fund manager can’t be passed through to the investor and must be used to offset gains within the fund. Whereas with an SMA, the investor owns the individual underlying securities, unlocking the loss-harvesting potential of each individual stock.
Question
If your client has capital gains elsewhere—in hedge-fund investments, real estate, and other holdings—those gains can, with some restrictions, be offset by the losses harvested in their equity portfolio. Under certain circumstances they can even offset ordinary income.
If your client has capital gains elsewhere—in hedge-fund investments, real estate, and other holdings—those gains can, with some restrictions, be offset by the losses harvested in their equity portfolio. Under certain circumstances they can even offset ordinary income.
Question
Even when the market is broadly up, certain stocks may be down. For example, in 2017, a year when the S&P 500® Index saw a total gain of close to 22%, 122 names in the index showed a loss for the year. If your client is invested in an SMA, and thus has access to the individual underlying stocks in the portfolio, those losses can be harvested to offset gains elsewhere in the portfolio.
Even when the market is broadly up, certain stocks may be down. For example, in 2017, a year when the S&P 500® Index saw a total gain of close to 22%, 122 names in the index showed a loss for the year. If your client is invested in an SMA, and thus has access to the individual underlying stocks in the portfolio, those losses can be harvested to offset gains elsewhere in the portfolio.
This information has been provided for discussion purposes only. It does not purport to address all the financial, tax, and legal considerations relevant to investors.