


Investors may seek protection from volatile markets through derivatives, but it’s all in the details. Our institutional investing experts share how to prepare if last year’s troubles persist into 2023.
The year 2022 will go down in the books as one of the top 10 most volatile years for equity markets since the Great Depression. In an ironic twist, those who sought protection early in the year via the options market were by and large sorely disappointed. The markets reacted largely in line with many investors’ expectations that 2022 would see the most predictable drawdown in stocks in recent memory. Hedges, specifically those structured using options, generate handsome payoffs when markets deviate significantly from the prevailing consensus. Because many investors were already positioned for a difficult year, those who put a hedge in place early in the year by purchasing options generally realized suboptimal results.
Given the strong positive correlation between both equities and fixed income in 2022, many portfolios may have maintained their asset allocation within tolerance ranges even after considering heightened volatility. However, those who believe the current volatility regime will persist into 2023 may wish to consider a more disciplined process for better maintaining their asset allocation, especially if last year’s strong equity–fixed income correlation moderates in 2023.
How should investors prepare their portfolios for ongoing volatility?
While the overall trend for equities was clearly down, investors who employed a systematic rebalancing program with daily measurement frequency potentially added significant value. There were three periods in 2022 over which the S&P 500® dropped by more than 13% and subsequently recovered by at least 10%. These meaningful movements offer the ideal environment in which disciplined portfolio rebalancers can monetize volatility. That said, these significant market gyrations were all but eliminated if investors measured market performance at calendar quarter-end dates only. The S&P 500® printed mid- to high-single-digit negative returns in each of the first three quarters of 2022.
S&P 500® performance, 2022
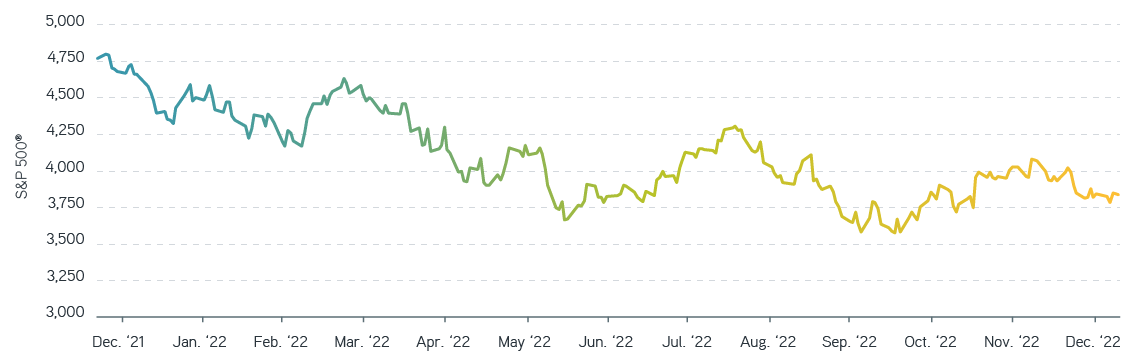
Source: Bloomberg, 12/31/2022. For illustrative purposes only. It is not possible to invest directly in an index. The S&P 500® is a trademark of S&P Dow Jones Indices LLC.
Will 2023 be any different? Wall Street prognosticators are already signaling continued market turbulence, which may suggest the options market is set up as it was a year ago. However, although the Volatility Index (VIX®)—a common barometer of equity market turbulence—is essentially at the same level as it was on December 31, 2021, the relative pricing of put and call options has changed meaningfully over the course of 2022, offering some potentially interesting structures to consider for those seeking to address downside risk.
Investors have told us that they expected the VIX® to have been higher over the past 12 months, given the significance of the market drawdown. In simple terms, the VIX® measures a basket of S&P 500® call and put options with approximately 30 days to expiration. While the actual formula to determine the VIX® is complicated, each of the options used in the calculation are weighted based on their strike price, and put options have a larger weight than call options. This means relative changes in the volatility of the puts and calls used in the calculation of VIX® can meaningfully influence the VIX® level.
A volatility curve is a plot of the implied volatilities of multiple put and call options across a range of strike prices, all which have the same time to expiration. We’ve often observed that the implied volatility of put options exceeds that of call options with a similar strike price, such that the volatility curve slopes downward. We refer to the magnitude of this slope as volatility skew. Much like an interest rate curve, the volatility skew is dynamic, flattening or steepening based on market activity. Over the past year we observed a significant flattening of the S&P 500® volatility skew, meaning the implied volatility of put options declined relative to that of call options for the same strike. The volatility skew hit a five-year low midway through Q4 2022.
What does this mean for the VIX®? As mentioned, put options are weighted more significantly than calls in the VIX® formula. This means the VIX® tends to rise and fall with the level of implied volatility of put options. However, if changes in the implied volatility of put options are meaningfully less than corresponding changes in those of call options, the VIX® could remain unchanged, or even move in the opposite direction, as we saw in 2022.
Implied volatility of 30-day S&P 500® index options
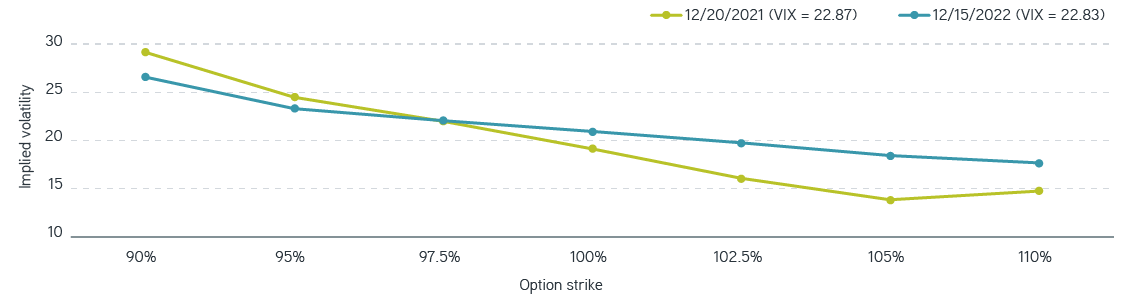
Source: Bloomberg, 12/31/2022. For illustrative purposes only. Not a recommendation to buy or sell any security. It is not possible to invest directly in an index. The Volatility Index (VIX®) is a trademark of the Chicago Board Options Exchange.
Note that the curve from late 2021 exhibits a more significant amount of skew. The more recent curve shows that call option implied volatility increased meaningfully more than the declines in that of put options. Because of this, the VIX® on both days came in nearly identical at 22.8. This flattening of the volatility skew had a dampening effect on the VIX®. On a relative (volatility) basis, puts became relatively cheap or calls became relatively expensive. For investors who remain cautious on the markets, call overwriting and collar strategies are now more attractive from a historical pricing perspective.
How should investors respond to anemic forward return expectations?
In tandem with continued market volatility, many institutional investors and consultants have placed low expectations on returns for equity markets over the coming year, if not longer. Investors may consider a number of strategies to bolster expected returns relative to long-only equity and fixed income portfolios, including:
- Portfolio leverage
- Portable alpha
- Increased allocations to private investments
- Call writing
- Increased allocations to private investments
- Cash management solutions
The first two items in the list above employ the use of leverage. Leverage amplifies outcomes, both good and bad, so it’s always prudent to consider the potential significant negative effects. Although investors can achieve leverage through explicit borrowing, it’s often employed via derivatives. Investors considering leverage typically know the asset classes that will be used for leverage, but they often underestimate the various ways through which financing costs can be reduced. For instance, the financing costs of derivatives vary by asset class. Investors may benefit from replacing passive physical exposure with synthetic positions in asset classes that provide lower expected financing costs. They can then use the extra capital to invest in assets that carry a higher implied cost of borrowing, instead of bluntly employing a basket of derivatives across the assets that they seek to add to their existing portfolio.
As we mentioned, the current volatility regime provides a historically attractive environment for call-overwriting strategies. Investors can possibly generate higher incremental return from the collection of options premium via selling fully collateralized call options than in previous years. This strategy isn’t without risk: In exchange for collecting upfront income, investors forgo participation above the strike price of the calls sold. There are no free lunches, but some meals may be more attractively priced than others.
Further help may come from money-market and short-term investment funds. Thanks to the Fed’s aggressive rate hikes over the course of 2022, many of these funds are generating net returns below those of short-term Treasuries. As a result, investors may be able to increase expected return on liquidity funds by using a simple short-term Treasury ladder. The yield on a one- to 12-month Treasury ladder is 4.67% as of January 25. Investors who currently use an overlay program to equitize cash can increase capital efficiency by using US Treasury ladders as collateral for derivatives positions. Further, ladders can be expanded to corporate bonds to bolster cash flow driving investing for pensions.
Should investors expect higher and longer inflation?
While the headline CPI number is expected to decline over the coming months, inflation remains a major concern despite five- to 30-year inflation breakeven numbers hovering around 2.3%. A recurring question on the minds of investors is how inflation will manifest itself in risk assets. Some believe the pullback in global commodity prices from midyear highs will be temporary, while others feel opportunities exist in listed and private real assets. We’ve also observed some investors seeking to lower their total duration exposure within their fixed income portfolios, positioning for higher rates in the medium and long end of the curve.
Five-year, five-year forward inflation expectations, 2013–2023
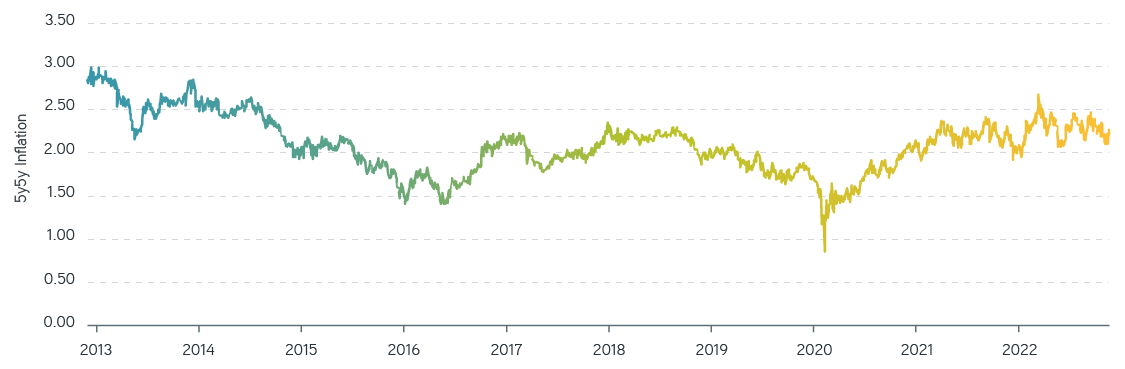
Source: Federal Reserve, 12/31/2022. For illustrative purposes only.
Investors have used a number of strategies over the past several months to combat ongoing inflation risk:
- Increased allocation to baskets of commodities or real assets, including listed real estate, global natural resources, and infrastructure
- Allocations to Treasury Inflation-Protected Securities (TIPS)
- Lower effective duration of fixed income portfolios
To the extent that inflation expectations are priced into various forward prices, investors may not benefit from making changes to their portfolio. Inflation-sensitive positions tend to do well when inflation exceeds expectations.
How should pension plans manage liability risk?
Decline in both equity and fixed income markets in 2022 clearly impacted the asset side of pension portfolios. Because of the significant increase in discount rates, the typical pension’s funded status improved concurrently. Many pension investors have restructured their fixed income portfolios over the past decade to match the profiles of their liabilities. However, since many pensions are less than 100% funded or hedged, these portfolios still retain meaningful interest rate exposure.
At the beginning of 2022, pension investors were hesitant to consider increasing their effective liability hedge ratio using derivatives, given the view that rates had only one way to go. At the time, the effective yields at the 10-, 20-, and 30-year points on the curve were 1.78%, 2.17%, and 2.28%, respectively. But these rates had dropped by 50% or more just a few months later and then started a steady climb into the year end, with rates finishing 2021 still well below where they had started. Those who had added duration through an overlay were rewarded with gains on synthetic positions, offsetting the increase in the present value of liabilities. Many investors again remained wary at the start of 2022 of increasing their effective hedge ratio, continuing to believe rates would only increase. As the Fed started their aggressive tightening, the back half of the curve followed suit, and rates ended the year more than two times higher.
We believe no one can accurately predict the movement of interest rates, let alone any market risk. As such, we remain ardent supporters of investors seeking to hedge uncompensated risk. At this point in time, with medium- and long-term rates at their highest levels since early 2014, we believe pensions should consider increasing the effective liability hedge ratio through physical or synthetic investments, with the goal of reducing the risk that interest rate movements have on the liability side of the equation.
Furthermore, many corporate pensions are in improved financial positions thanks to increased funded ratios and the inverted yield curve environment. We believe investors should place an even higher emphasis on minimizing the basis risk of their rate hedges through curve-matching strategies. Duration completion portfolios fit nicely in this environment as a means of reducing deviations between asset and liability exposures at various points across the curve. Intermediate corporate bonds are growing in importance as effective liability durations have decreased. Cash-flow matching bond ladders can be an effective and efficient tool for plans seeking to supplement growing and diversified liability-hedging portfolios.
The bottom line
If there’s one consistent message from financial observers about the year ahead, it’s that we shouldn’t expect it to be smooth or broadly positive. But institutional investors should take care not to overcorrect. With the right solutions, they can find ways to unlock additional portfolio value without sacrificing cost control, borrowing power, or liquidity. Professional guidance in selecting and implementing these solutions can be the best investment institutions make in 2023.
Risk management solutions for uncertain markets