


The brackets of March Madness can consume both diehard fans and casual followers of college basketball. Old rivalries are stoked, and friendly wagers are made among friends, neighbors and coworkers. This annual rite of spring seems perfectly timed to set a cheerful tone—it may even be therapeutic. Just a few weeks after the tournament concludes, a different set of brackets takes center stage in the lives of US taxpayers.
To prepare for that letdown, every November the Internal Revenue Service (IRS) announces the new tax brackets for the following year. Here are the new brackets for tax year 2024, for the income tax returns taxpayers will file by April 2025.
IRS income tax brackets for 2024
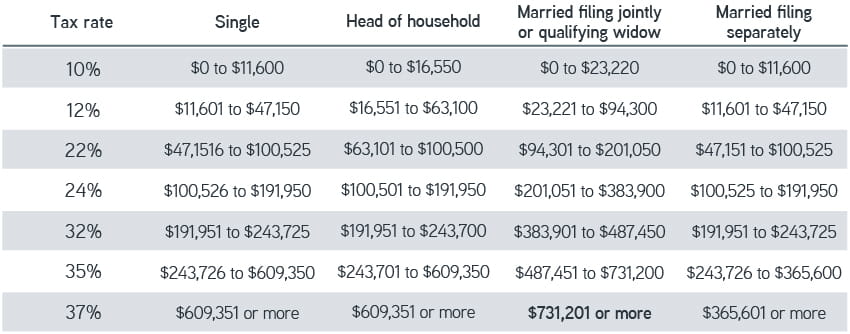
Source: IRS, November 2023.
How tax brackets evolved
Before 1981, tax brackets were fixed for 25 years straight. Bracket creep became a dynamic where increases in wages pushed more taxpayers into higher marginal tax rates at the same time that high inflation rates were eroding the purchasing power of their remaining dollars.
The Economic Recovery Tax Act of 1981 (ERTA) was intended to address bracket creep by requiring that key elements of the tax system be indexed for inflation. Federal law now mandates that tax brackets adjust each year for inflation. With the high inflation rates of the past two years, tax brackets have been steadily shifted upwards. In 2023, bracket thresholds increased by 7% from 2022, and in 2024, thresholds rose another 5.40% across the board.
To see how this dynamic played out, consider that in the 1970s, inflation was particularly high, rising by 1980 to 13.5%—a rate not seen since the end of World War II. After ERTA, many US taxpayers benefited from both rising wages and tax brackets adjusting to moderate rates of inflation.
Top tax bracket threshold versus rate of inflation
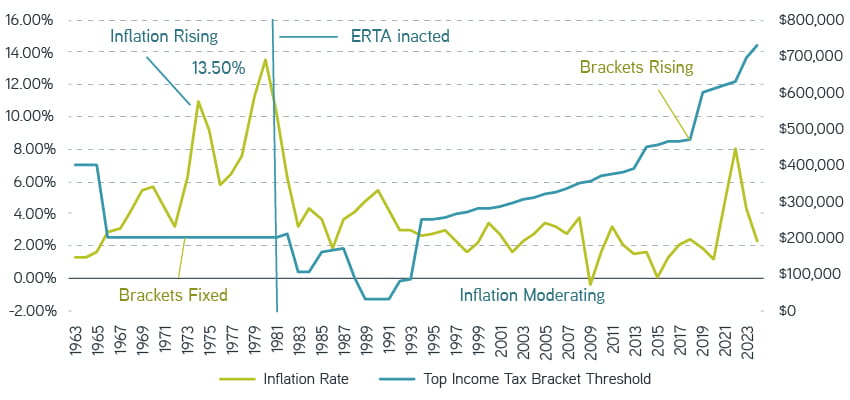
Source: IRS.
Bracket creep did not end there, however. ERTA had addressed only one variable, inflation. By tinkering with the number of tax brackets, legislators could theoretically capture similar or even greater amounts of tax revenue.
In the 1960s and 1970s, there were as many as 26 tax brackets, reaching the highest rate of 91%. Yet few people fell into that top bracket with a threshold income of $400,000 in 1963. That’s equivalent to a little over $4 million in today’s dollars.
In the 2024 bracket release from the IRS, only seven tax brackets remain with a top rate of 37% for those married filing jointly with a threshold income of $731,201. Even though today’s top tax rate is much lower, far more households reach that threshold.
Top tax bracket rate history
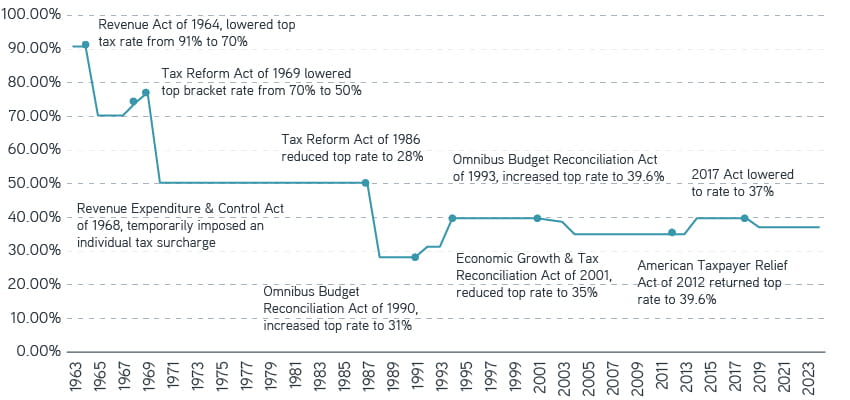
Source: Congressional Budget Office (CBO).
Another important milestone is the Tax Reform Act of 1986 (TRA-86). With this legislation, Congress reduced the top income tax rate from 50% to 28% and cut the number of tax brackets from 15 to five, while widening the bracket range to put more households at the top tax rate.
Consider the benefits of active tax management
Introducing taxes on long-term capital gains
The most impactful change of the TRA-86 was how it modified the taxation of capital gains. Until 1986, up to 60% of long-term capital gains could be excluded from a taxpayer’s Adjusted Gross Income (AGI). At the time, the average holding period for stocks was roughly seven years, so most capital gains were long term.
By removing that exclusion, TRA-86 captured a much greater proportion of income from the highest earners. From the latest IRS data available, as income rises, capital gains and dividends comprise a growing percentage of a taxpayer’s AGI.
Capital gains and qualified dividends as % of AGI, 2020
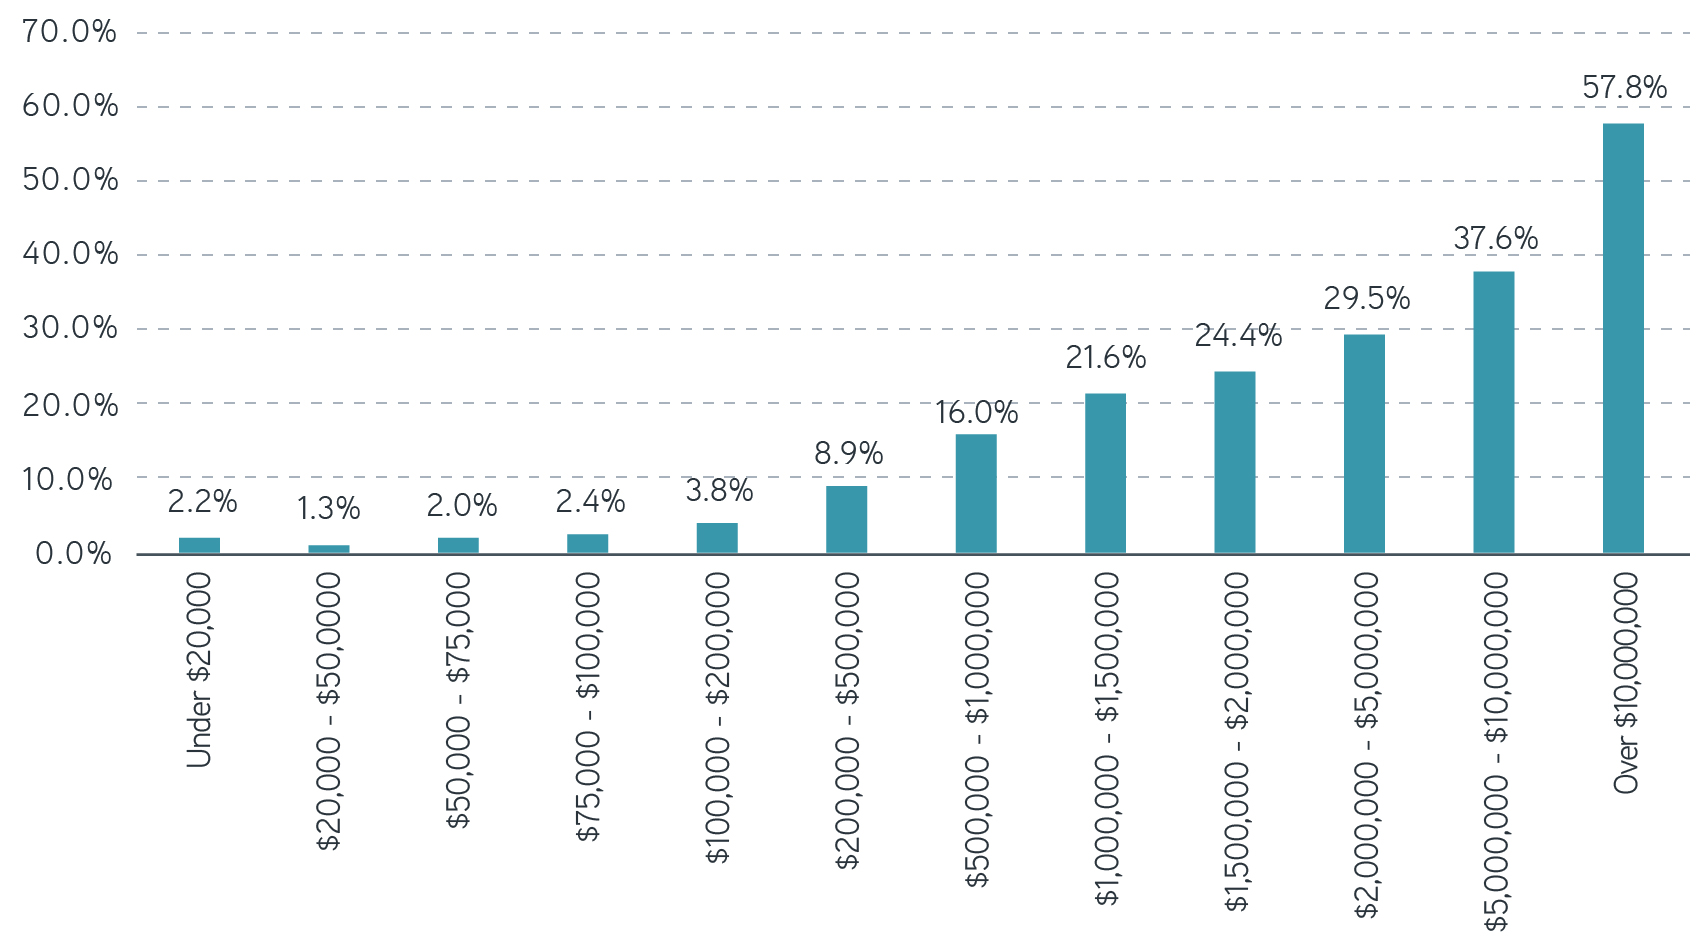
Source: IRS Statistics of Income division, Publication 1304, November 2022.
Eliminating the capital gains exclusion helped to motivate the idea that managing portfolios for tax efficiency could offer investors a source of previously untapped alpha—tax alpha. At the same time, advancements in computer technology during the late 1980s and early 1990s, along with academic research supporting the value add of tax-loss harvesting, ultimately led to the creation of direct indexing portfolios.
Outlook for a US presidential election year
With that historical perspective in mind, let’s assess upcoming issues in tax legislation. This year’s presidential election looms large in determining future tax policy. The timing is particularly important, because the new president will face the scheduled expiration of most individual income tax provisions in the 2017 Tax Cuts and Jobs Act (TCJA) soon after the inauguration.
With this expiration, the top tax rate would revert to 39.6% from 37%, while the threshold for the top bracket would fall back to the 2017 level of $470,700 (married filing jointly), or $553,600 when indexed for inflation. So more taxpayers would find themselves in the top tax bracket facing a higher tax rate.
A largely overlooked change in the TCJA was to link the tax bracket adjustment to the so-called chained consumer price index (CPI) instead of the traditional CPI. Chained CPI attempts to capture consumption choices as prices rise. If the cost of apples increases, for example, consumers may switch to pears, so that choice can blunt the impact of inflation. Traditional CPI simply measures the rise in the cost of apples, so the estimate of inflation tends to be higher.
Switching to a lower estimate of inflation using the Chained CPI calculation methodology results in tax brackets growing more slowly in the future—exacerbating the bracket creep. As taxpayers with steadily rising incomes get close to reaching the threshold, they will be bumped into the next bracket sooner. This change isn’t scheduled to expire in 2025.
The bottom line
Tax law changes tend to follow a pattern of give and take—for every increase or decrease in one aspect of tax policy, we expect to see an offsetting decrease or increase in another aspect. Depending on the outcome of the US presidential election, a potential trade-off dynamic to watch for could be that some TCJA provisions are extended or made permanent, while other proposals would raise taxes on capital gains by as much as 5% across the board.
Staying ahead of the ever-creeping April brackets requires vigilance, planning and fiscal agility that may be comparable to the athletic ability of elite college basketball players. Time will tell how these brackets play out.
Parametric and Morgan Stanley do not provide legal, tax or accounting advice or services. Clients should consult with their own tax or legal advisor prior to entering into any transaction or strategy.