


Gross returns are important, but a portfolio’s after-tax return is where the rubber meets the road—particularly for investors who depend on distributions for income. In our view, systematically combining municipal, corporate, and Treasury securities, while engaging in opportunistic tax-loss harvesting (TLH) inside a separately managed account (SMA) ladder structure, has the potential to enhance after-tax returns compared with a traditional single asset bond portfolio.
A tax-optimized ladder (TOL) SMA harnesses technology to seek to optimize the allocation of municipal, corporate, and Treasury securities into a tax-efficient laddered portfolio. Year-round TLH has the potential to further enhance after-tax returns. Advisors can customize TOL portfolios to each investor’s unique tax situation, taking into account the different tax treatment of each asset class. TOL portfolios offer all the potential investment benefits of a traditional ladder structure at no additional fee.
Our response to three commonly accepted tax principles
Let’s start by reviewing three long-held foundational beliefs for fixed income investors encumbered by high marginal tax rates.
1. A municipal bond portfolio provides a higher after-tax return than a similarly-constructed corporate portfolio.
While this has been true most of the time, we’ve observed significant periods when other fixed income sectors may have been preferential. Because different factors determine the yields of corporate and municipal securities, their values ebb and flow relative to each other and to Treasurys. These relative movements continually change the after-tax value proposition among the three markets.
We see this especially when accounting for marginal tax rates. Over the past five years for an investor in the 40.8% Federal and 5% state tax1 brackets, 10-year maturity corporate bonds (as measured by the Bloomberg corporate curve) offered higher after-tax yields than either 10-year municipal or Treasury notes roughly 30% of trading days. Five-year maturity corporate bonds had the highest rank 35% of the time, while in the one-year maturity bucket, Treasury notes offered the highest yield 14% of the time. The lower an investor’s marginal tax rate, the more opportunities might exist in other sectors.
Percentage of time when each asset class offered the highest after-tax yield, past five years
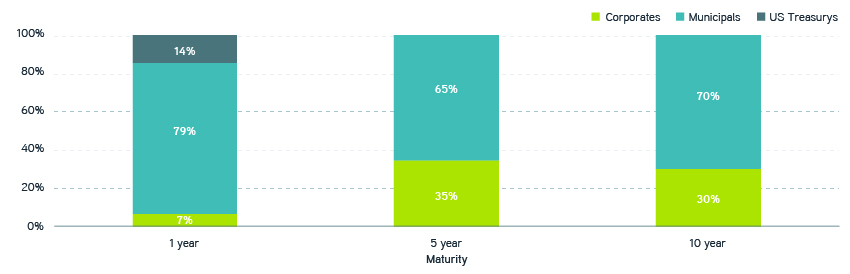
Sources: Parametric and Bloomberg, as of 1/31/2024. Corporate yields based on the Bloomberg US Corporate A+/A/A- BVAL Yield Curve. Municipal yields based on the Bloomberg US General Obligation A+/A/A- Muni BVAL curve. US Treasury yields based on the US Treasury Bills and Bonds BVAL Curve. Tax-rate assumptions include tax filing status as married filing jointly. For illustrative purposes only. Not a recommendation to buy or sell any security. Past performance is not indicative of future results. All investments are subject to risk, including risk of loss. It is not possible to invest directly in an index. Indexes are unmanaged and do not reflect the deduction of fees or expenses. This analysis is not meant to be tax advice. For more individualized information, you should consult your tax advisor or investment professional.
2. Tax-loss harvesting is best reserved for year end.
We believe that it can be far more effective to systematically harvest losses as they occur, rather than waiting for a fixed point in time. And typically at year’s end, maximum losses seldom occur. While more difficult to implement, this opportunistic approach could potentially add significant tax alpha to a portfolio.
3. Wide bid-offer spreads and the labor-intensive process associated with trading small lots combine to increase transaction and staffing costs, making it impractical to manage portfolios with year-round TLH.
This was true before the widespread adoption of electronic trading systems, but now technology has transformed the small-lot market—most notably by sharply reducing bid-offer spreads. Perhaps less appreciated is the immense amount of information generated across these systems. For those with the technology to properly consolidate and parse this data, being able to locate securities and assess issue-level liquidity can be invaluable.
Implementation challenges and opportunities
A TOL portfolio initially invests in state and national municipal markets, A-rated and BBB-rated corporates, and Treasury issues with the aim to maximize the after-tax yield. This is done by allocating available cash to the sector with the highest after-tax yield for a given maturity bucket, in accordance with the client’s specific tax situation, investment parameters, and risk tolerance. After the initial investment, any new cash in the portfolio is allocated to the sector with the largest after-tax yield available at that time, which could vary by maturity bucket. A prior allocation to one sector is no guarantee of a new allocation to that sector, as the relationship between sectors may change.
Managing thousands of separate accounts within the TOL structure requires proprietary technology to effect the systematic selection and analysis of thousands of securities. Portfolio construction logic needs to evaluate each security and curve within the context of the client’s specific tax treatment, individual credit outlook, and liquidity scores. It must also evaluate potential trades in the context of each account’s unique investment preferences and tax circumstances, including state of residence. This all has to be done while identifying TLH opportunities and avoiding wash-sale violations. Relative liquidity and quality mismatches between sectors can also complicate implementation.
Taking an investor’s tax rate, we can compare after-tax yields between market sectors for each maturity bucket. In addition to the Bloomberg US Corporate BBB+ BBB BBB- BVAL Yield Curve, we use the same Bloomberg corporate, Treasury, and municipal index curves detailed in the exhibit above as our source for indicative yields as of March 1. For an investor facing a federal tax rate of 40.8% and an additional 5% at the state level, municipal bonds had rich valuations relative to corporates in the three- to 10-year maturities, leaving the after-tax yield of the Bloomberg corporate curves higher than the Bloomberg municipal and Treasury curves. But in the one- and two-year buckets, the municipal curves had the highest yields of these three sectors after accounting for taxes.
If we equal weight bonds across one- to 10-year -maturity buckets of the tax-free spot yields in the Bloomberg municipal index from one to 10 years, the yield would average to 2.77%. If we equal weight bonds with the highest after-tax spot index yields selected from the Bloomberg corporate, Treasury, and municipal curves, the yield would average to 2.93%.
In today’s market environment, for an investor subject to a 40.8% federal tax rate and a 5% state tax rate, a blended allocation to the municipal bond index and the corporate bond index could potentially offer more income after taxes. Note that these results might vary based on each individual’s tax situation and the prevailing market dynamics, which are constantly changing.
Unlock TLH opportunities throughout the year
Facilitating year-round TLH
Ongoing TLH is an additional feature of the TOL SMA, which can’t easily be employed by either mutual fund or ETF structures. Systematically harvesting losses over the course of a year may create a tax asset that could be used to offset an investor’s other realized gains, potentially adding further after-tax alpha to the portfolio.
TLH strategies tend to be more effective when pursued in a systematic manner over the course of the year, but investors typically only review their portfolios for tax losses in December. In fixed income portfolios, where returns are mostly driven by changes in interest rates, yearly rate peaks have historically been distributed throughout the calendar year. Yields have only peaked in December on three occasions over the last 33 years. Systematic TLH ensures that losses can be captured when they occur.
For a good example of why it may not pay to wait until December to harvest losses, consider 2023. Interest rates rose sharply into October, and the price of the ICE BofA/Merrill Lynch 1–10 Year US Municipal Securities Index declined, offering a prime TLH opportunity at that time. But if an investor had waited for December, that opportunity might have passed. The index was only modestly lower than where it began the year on the first two trading days of that month.
2023 monthly municipal bond prices
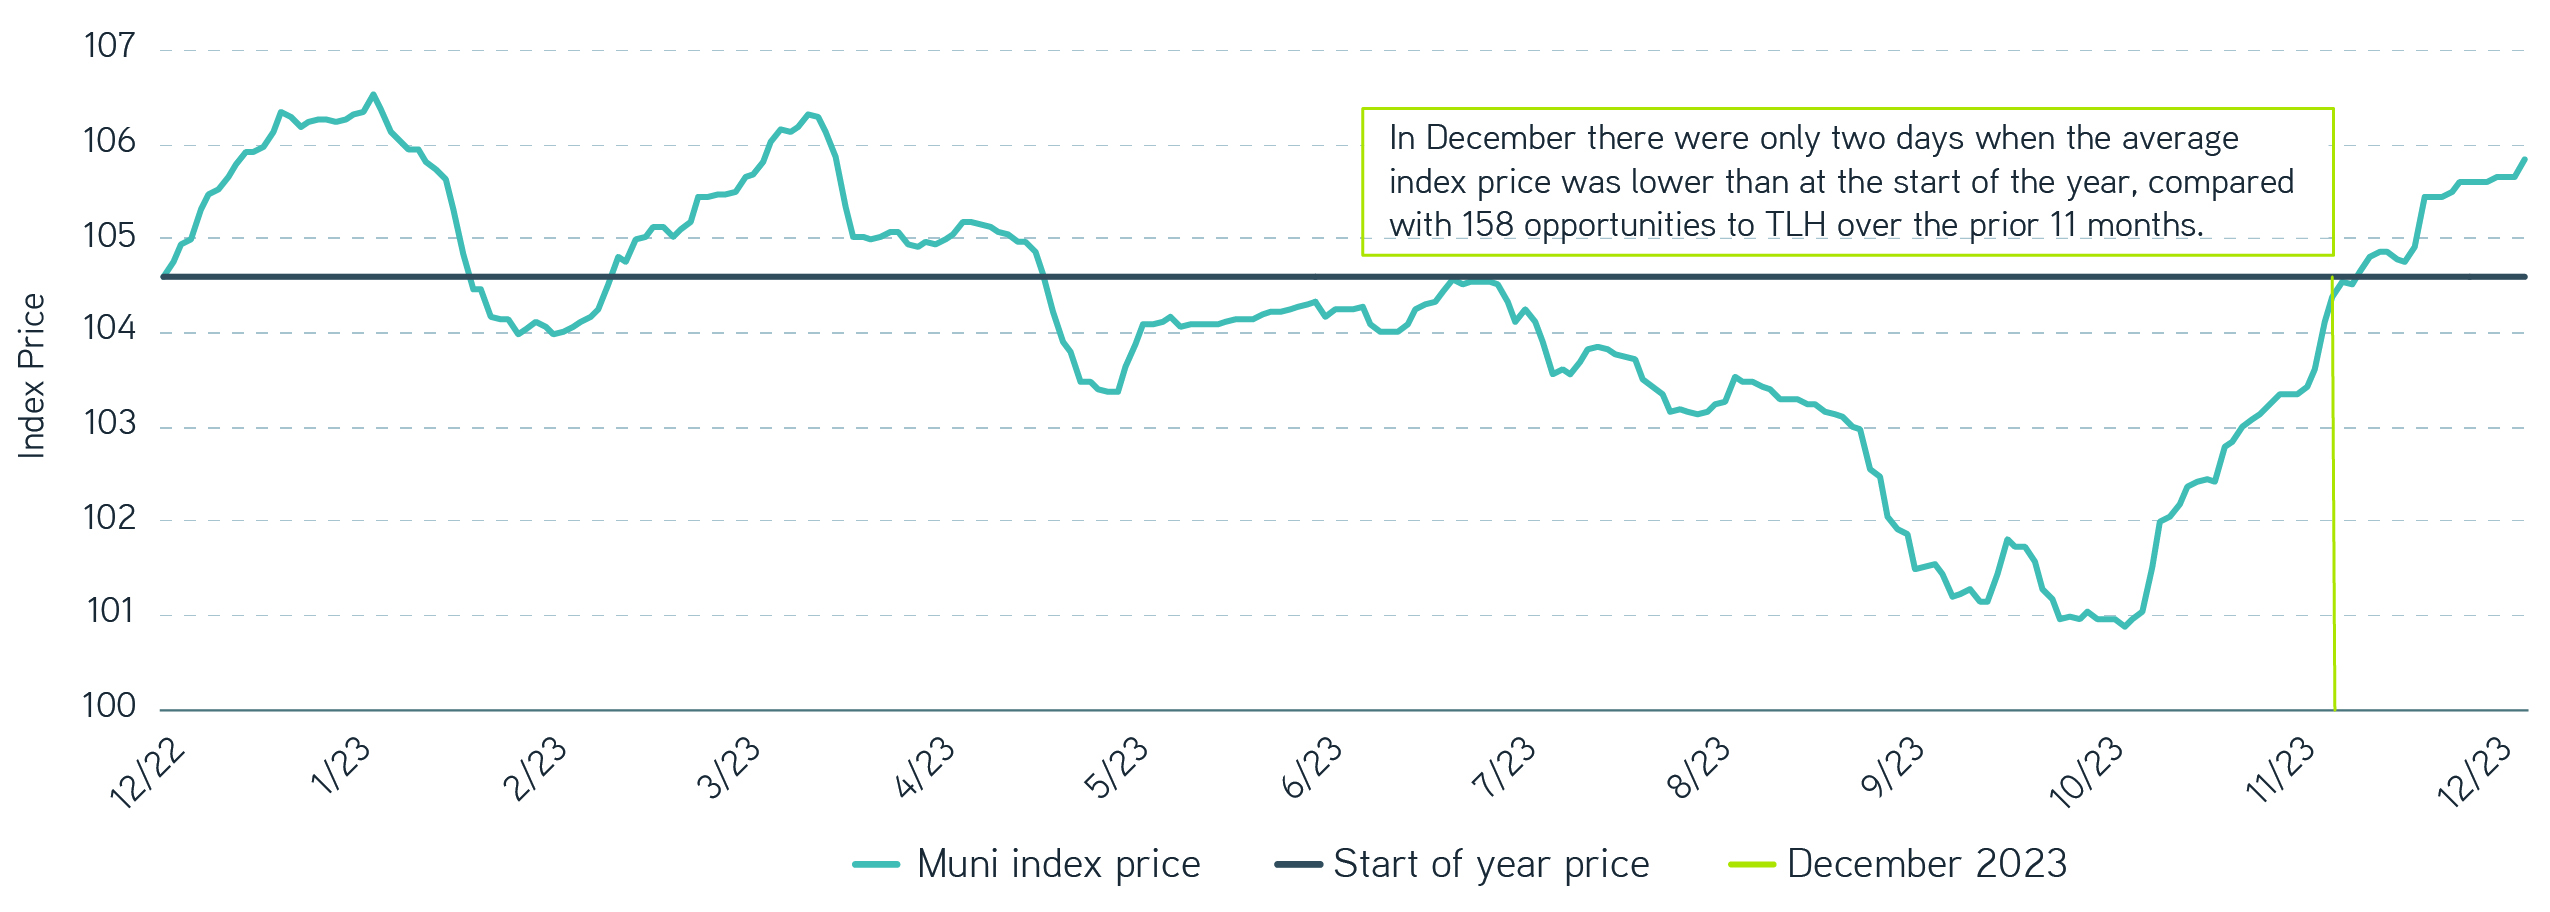
Source: ICE BofA 1-10 Year US Municipal Securities Index, 12/31/2024. For illustrative purposes only. Not a recommendation to buy or sell any security. It is not possible to invest directly in an index. Indexes are unmanaged and do not reflect the deduction of fees or expenses. Past performance is no guarantee of future results.
Harnessing technology
Implementing this strategy requires a significant commitment to technology. Tracking the individual cost basis—which changes over time as bonds purchased at a premium or discount move toward par—and comparing that evolving cost basis to current market prices is complicated, particularly for securities owned across thousands of accounts. Importantly, trades should only be executed if the tax benefit outweighs the transaction costs of realizing the loss and reinvesting. Finally, any new trades must avoid generating wash-sale violations.
The bottom line
Advisors can implement these improvements to the single-asset ladder structure without additional cost to the investor, and the potential advantages—especially when compounded over time—might be compelling. We believe that this may be a particularly appealing time to implement a TOL portfolio structure. In our view, all-in yields across the sectors remain attractive. The economy may also return to a more traditional business cycle, which could result in more opportunities to direct a TOL portfolio’s cash to the sector with the highest after-tax yields.
1 According to the Tax Foundation, the average maximum tax rate for all states is 5.12%.
Parametric and Morgan Stanley do not provide legal, tax or accounting advice or services. Clients should consult with their own tax or legal advisor prior to entering into any transaction or strategy.