

With short-term rates rising, investors may be tempted to keep their assets in cash. For long-term investors, however, the right ladder strategy can take advantage of high rates while reducing risk.
It’s been a year since the Federal Reserve began tightening monetary policy to rein in inflation. With the federal funds rate approaching 5% and the Fed indicating its willingness to keep rates higher for longer, it’s tempting to stay in cash, especially with Treasury yields declining the further out the curve one invests. However, for long-term investors, we believe the current market environment warrants moving out the curve into a Treasury, corporate, or municipal ladder to lock in the highest yields in more than 15 years. While this move would increase duration, it can also reduce reinvestment risk and offer performance advantages should the economy enter a recession. We think this trade-off is a good one.
Fed policy to address the 2008 financial crisis resulted in short-term yields significantly lower than the rate of inflation for multiple years. While we don’t expect the rapid collapse of Silicon Valley Bank to have the same economic repercussions as the Lehman Brothers default, both events sparked an immediate widening in financial spreads, a strong regulatory response to support the sector, and a significant drop in short-term Treasury rates. The market is now pricing in two rate cuts by year-end, and two-year Treasury yields have fallen by as much as 70 basis points (bps) over the past two weeks.
Leading up to this flight to quality, short- and long-term rates had surged higher as the spike in inflation forced a vigorous response from the Fed. Reeling from significant losses in both their stock and bond portfolios, many investors have taken refuge in cash and other short-term fixed income instruments. Ironically, the retreat to ultra-short maturities, while attractive compared to the extremely low rates of the last decade, is occurring at a juncture where the additional risk of extending duration is likely to be more than offset by the lower reinvestment risk.
What is reinvestment risk?
Reinvestment risk is the likelihood that, over an investment horizon, investors will reinvest proceeds of a maturing bond at a lower yield than the original position. At first glance, purchasing a three-month Treasury bill in early March 2023 at a nearly 5% yield seems extremely attractive. But if short rates fall sharply, either from a change in Fed policy or from the market anticipating an economic slowdown, subsequent reinvestment income may be at substantially lower rates than the original investment.
As one would expect, short-term and money market accounts are particularly vulnerable to reinvestment risk. Investors can reduce that risk by purchasing securities with longer maturities. But the longer the maturity of an investment, the greater its interest rate or duration risk, which can contribute to portfolio volatility. If rates rise substantially, longer-maturity bonds will have greater unrealized losses than shorter maturity ones. However, longer maturity locks the yield or coupon cash flow in for a longer period, reducing the reinvestment risk.
How can we balance the two risks? A laddered bond portfolio permits an investor to lock in higher rates for a longer period than cash, with less duration risk than a long-maturity bond. Because a ladder strategy is rules-based, it systematically reinvests maturities at higher yields if interest rates rise, and because only a portion of the portfolio matures in any given year, it reduces reinvestment risk should yields fall.
What should fixed income investors do when the yield curve inverts?
It’s important to note that the Treasury yield curve normally slopes upward. This slope—or term premium—compensates investors for the additional price volatility of longer-term bonds. During a normal economic cycle, intermediate and long-term yields begin to rise in anticipation of higher inflation. Because short rates generally don’t rise meaningfully until the Fed begins increasing rates, short rates remain anchored, steepening the curve. As the Fed begins raising rates, short rates typically begin to rise faster than long rates, flattening the curve. If the Fed increases rates quickly enough, the curve may invert as short rates rise due to tighter policy, while longer rates fall in expectation of a weaker economy and lower inflation. An inverted yield curve has preceded each of the last six recessions and is a late-cycle indicator.
During this final stage, the Fed pivots, cutting rates to combat the economic weakness and restore consumer confidence. As a result, short rates decline rapidly, steepening the curve and quickly erasing the yield advantage that short-term bonds offer. Currently the curve is sharply inverted, since short-term rates have risen faster than long-term rates in response to eight Fed rate increases that total 4.5%.
Flexible fixed income solutions for turbulent times
US Treasury yield curve, 12/29/2000–12/31/2001
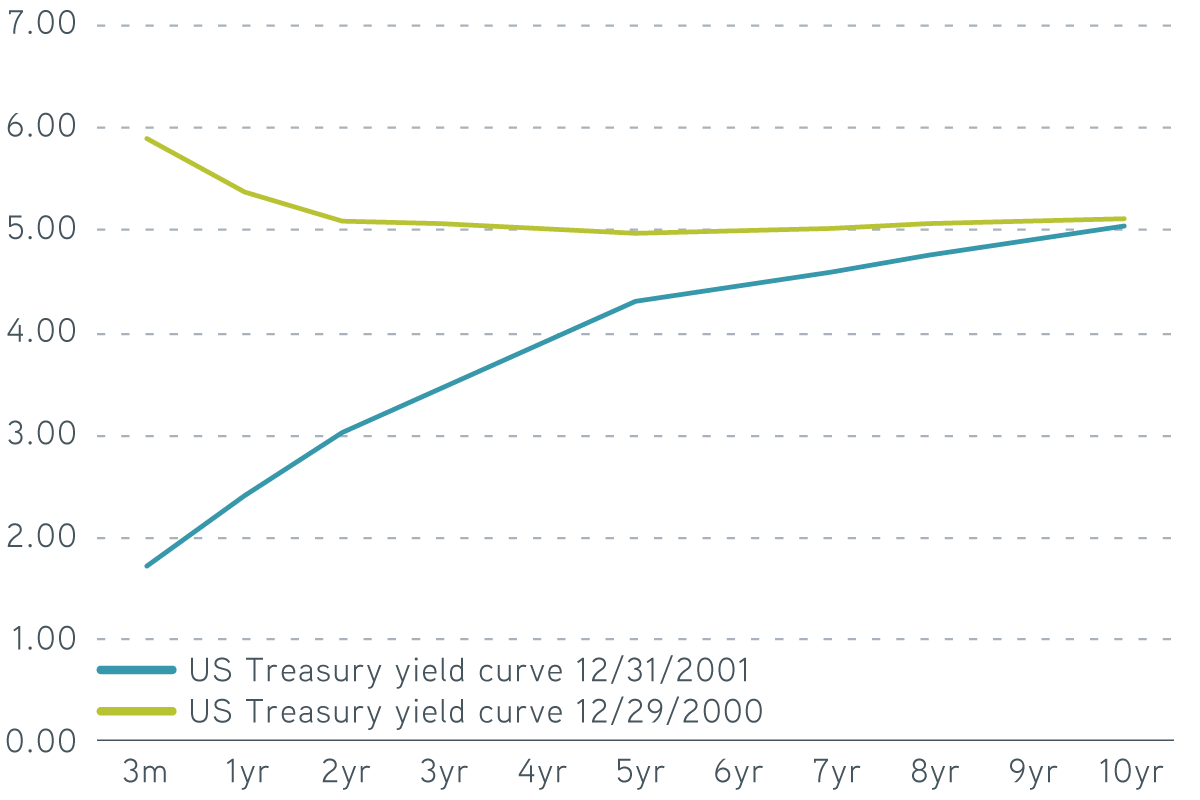
Source: Bloomberg. For illustrative purposes only. Not a recommendation to buy or sell any security.
What happens to laddered bond portfolios when interest rates fall?
The Fed shifted from raising rates in the middle of 2000 to cutting them 11 times during 2001 as the economy slipped into a recession following the burst of the technology bubble. The drop in yields during this period highlights how quickly reinvestment risk can lower incomes. Over the course of that year, the federal funds rate fell by 4.75%, while three-year Treasury rates declined by 1.60%. The combination of sharply lower short rates and only moderately lower intermediate rates steepened the Treasury yield curve, with the ICE BofA 1-3 Year US Treasury Index going from underyielding the ICE US 1-Month Treasury Bill Index by 104 bps to outyielding them by 113 bps.
This yield curve shift resulted in the 1-3 Year US Treasury Index producing a 8.2% return during 2001, improving on the 5.3% yield at the start of the year. During the same period, the ICE US 1-Month Treasury Bill Index generated a 3.8% return, well below its 6.4% start-of-period yield. The reduction in performance in the shorter index is a direct result of its greater reinvestment risk.
But changes in interest rates aren’t the only variables at play. The performance of a corporate or municipal ladder also depends upon valuations and the specific issuers in an account. To provide downside protection against company-specific risk, we advocate incorporating bottom-up credit research into the portfolio construction process. Parametric only purchases corporate and municipal bonds of issuers that our analyst team has reviewed and approved. It’s been our experience that fundamental research has the potential to uncover problem credits before financial markets and rating agencies react.
The bottom line
Fed policy is finding traction in slowing both inflation and economic growth. Combined with the predictive consistency of an inverted Treasury curve, a recession in 2023 remains a distinct possibility. An eventual shift in Fed policy is likely to cause the yield curve to normalize, since short rates fall much more quickly than long rates, exposing investors to a high degree of reinvestment risk. A ladder strategy could help mitigate both reinvestment risk and credit risk while locking in attractive yields.