


Fixed income investors may be surprised to learn how much money an efficient trading desk can save them. We analyzed our own trades to find out.
Public securities trading has undergone significant changes over the last 40 years. Decimalization and electronic trading platforms have nearly eliminated the bid-offer spread in US equity markets, creating an almost frictionless trading environment. These same processes now dominate most futures and Treasury market trades, and they’re rapidly spreading into US investment-grade (IG) and US high-yield (HY) corporate bond markets. Trade execution is especially important in these markets, where transaction costs between securities can vary greatly.
Fixed income markets present multiple structural challenges, so reducing liquidity costs has been more difficult. Structural impediments include high minimum trade sizes, large numbers of issuers, multiple discrete issues of varying maturities, and differences in credit quality—even among securities from the same issuer. To better understand the resulting technical barriers, we analyzed thousands of trades executed for Parametric’s laddered corporate fixed income separately managed account (SMA) portfolios to quantify the value of execution proficiency and liquidity costs.
The fixed income trading (r)evolution
Market fragmentation has historically made credit trade execution a labor-intensive process. For instance, the 500 discrete companies comprising the S&P 500® represent nearly 80% of the entire US equity market. By comparison, the ICE BofA US Corporate Index contains more than 9,000 bonds issued by more than 1,200 distinct issuers. Before electronic trading, traders had to pick up the phone and physically contact counterparties until they uncovered a good bid or offer.
For many years, this inefficiency limited the number of trades that could be executed, decreased transparency into order flow, and incentivized block trading (trades above $5 million in IG and $1 million in HY) over odd-lot trading (trades below $100,000). The result was extremely wide bid-offer spreads in odd-lot trading compared to with trades. But these barriers are rapidly disappearing as traders execute more transactions electronically. A recent Coalition Greenwich study estimates 37% of IG trading in 2021 was conducted through electronic platforms, up from only about 8% in 2013.
Where can bond investors find the lowest liquidity costs?
To quantify liquidity costs, let’s begin with a working definition. We think of liquidity as the ability to transact a bond and liquidity cost as the fee for trading a bond. Said another way, liquidity cost is the distance between the bid, where you can sell a security, and the offer, where you buy the same security. The wider the bid-offer spread—also called the bid-ask spread—the higher the liquidity cost. Many factors drive liquidity costs, but riskier securities generally mean wider bid-offer spreads. Transaction costs are also influenced by the age, size, and ratings of the issue, as well as market conditions. According to MarketAxess (MA), liquidity is highest and bid-offer spreads are narrowest in the days immediately following a bond’s issuance.
Trade Reporting and Compliance Engine (TRACE) trades executed in 2021
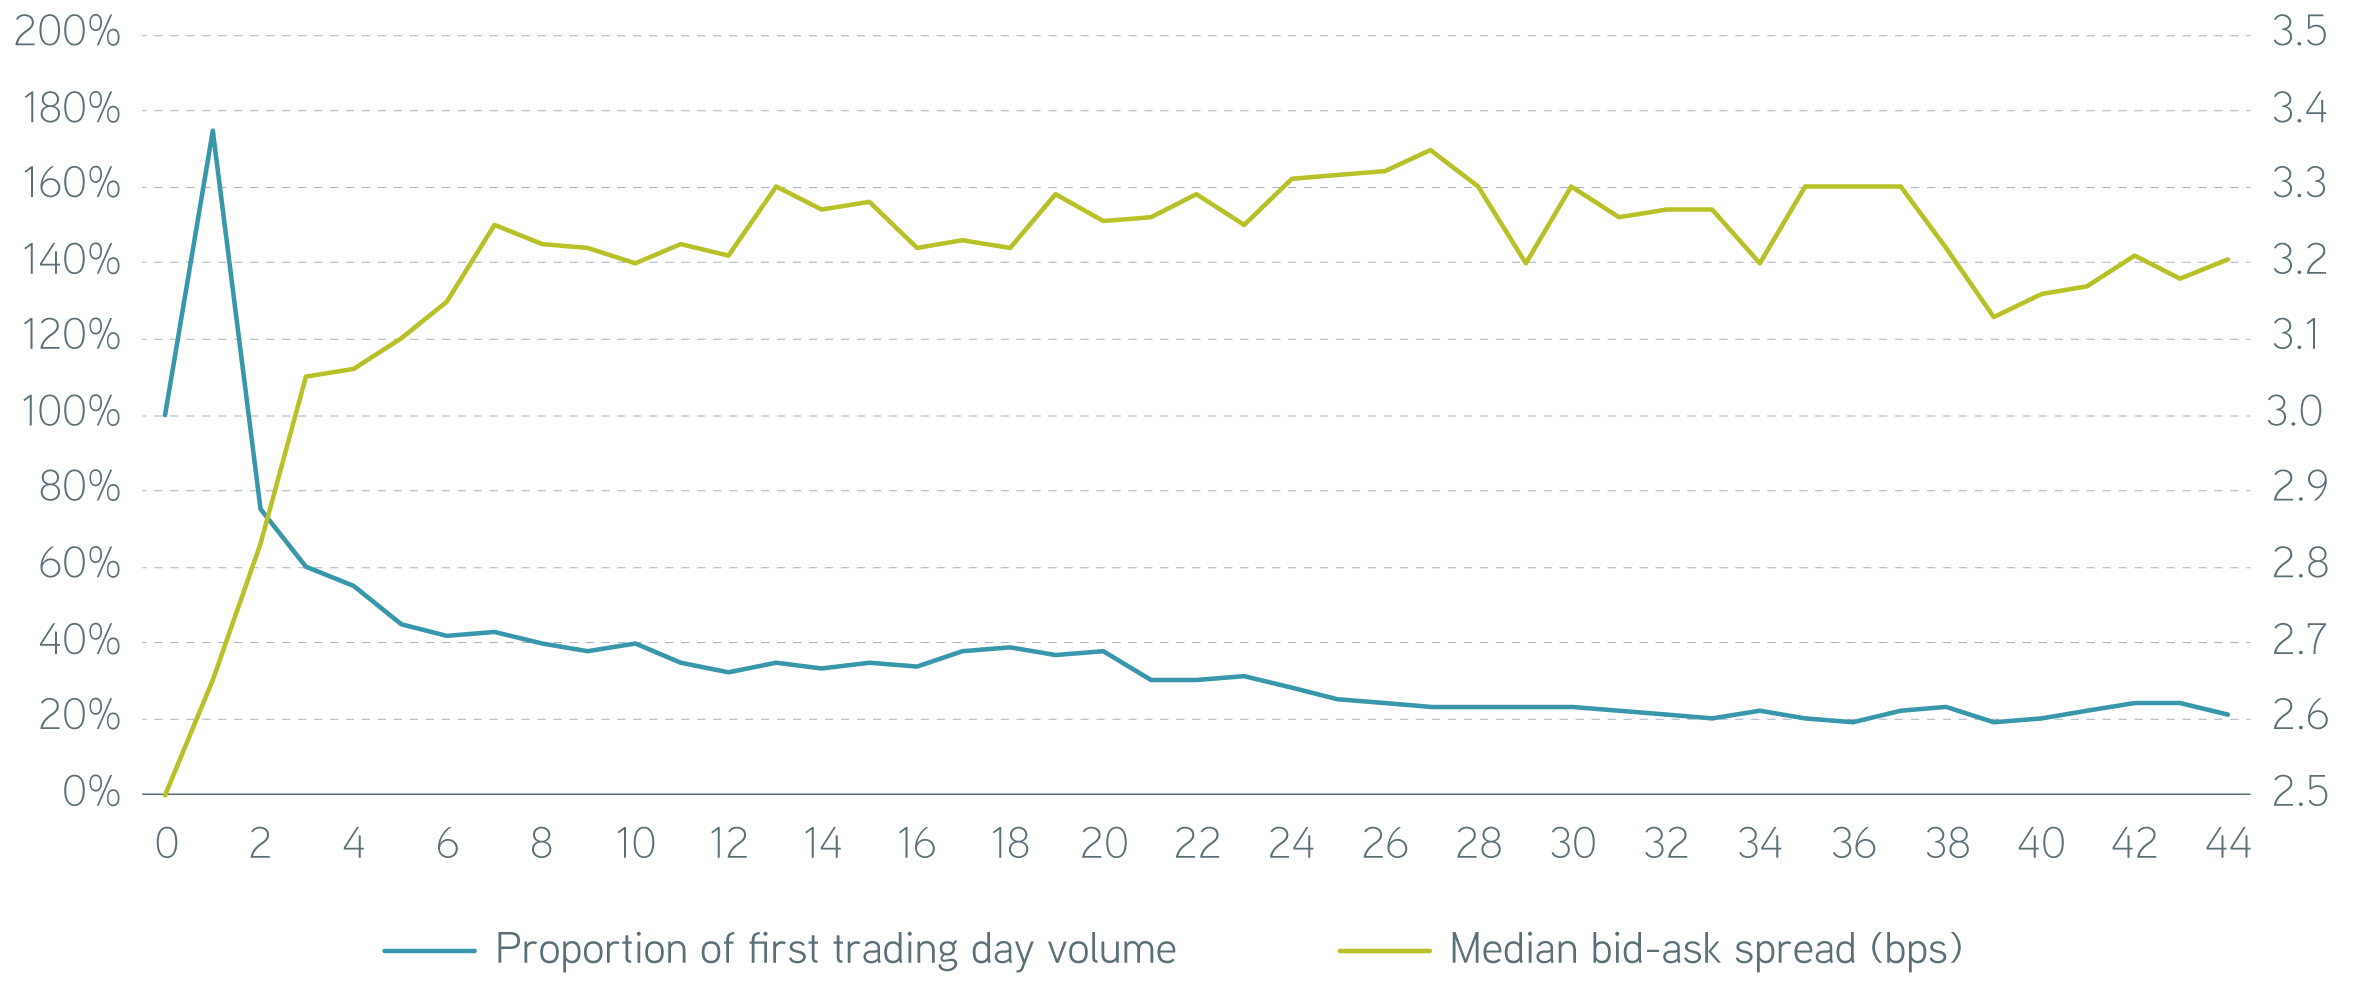
Source: MarketAxess, 12/31/2021. For illustrative purposes only. Not a recommendation to buy or sell any security. Past performance is not indicative of future results.
On the day of issuance, volume reaches multiples of the par amount of a security’s issuance and subsequently declines to a small fraction of issuance par. As the number of trades decline, the average bid-offer spread widens, reflecting the decline in liquidity. It’s important to realize that most issuers only issue at a few select maturity points on the curve. 70% of new bonds are issued with a five-, 10-, or 30-year maturity. Most bonds purchased at other maturity points along the curve have likely been issued for some time (seasoned bonds). For instance, when constructing a five- to 15-year laddered portfolio composed of one-year maturity rungs, the 14-year maturity is likely to be a bond that was issued 16 years ago with a 30-year maturity.
We offer tax-advantaged core bond market exposure
MA is an electronic trading platform that facilitates thousands of corporate bond trades daily. In addition to providing increased efficiency and reduced friction in transacting corporate bonds, each trade generates data that can be used to generate insight into market structure. It provides an effective way to measure market averages of volume-weighted bid-offer spreads across multiple sectors, maturities, and trade sizes. The Bid-Ask Spread Index (BASI) allows us to compare Parametric’s executions with the broader market and quantitatively assess the effectiveness of our trading desk.
When it comes to bid-offer spread, traders have always considered size to be one of the most important influencing factors. Institutional block trades of five million or more have historically enjoyed a distinct price advantage over micro-lot trades of 100,000 or less. The BASI bid-ask spread for micro lots in November 2008 was nearly 80 basis points (bps), while block trades were executed at a bid-ask spread of 14 bps. The 66-bps execution drag on a 10-year maturity security with a duration of six years adds nearly $4 to the price of a bond traded in a micro-lot size. As electronic trading has increased, the trading costs for micro lots have collapsed. The micro-lot BASI bid-ask spread is now only 6.6 bps, while block trades have declined to 2.3 bps. The price differential on the same six-year duration bond is now only 26¢—an astounding improvement.
Parametric’s IG credit traders were early adopters of electronic trading. Due to the composition of our SMA client base, the vast majority of our trades fall into the micro-lot category. With thousands of clients with differing needs and objectives, the trading desk frequently executes both buy and sell orders for the same security on the same day. We’ve collected data on more than 28,000 corporate bond trades meeting this criterion over the last five years.
Distribution of Parametric’s trades by bid-ask spread for buys and sells executed on the same day
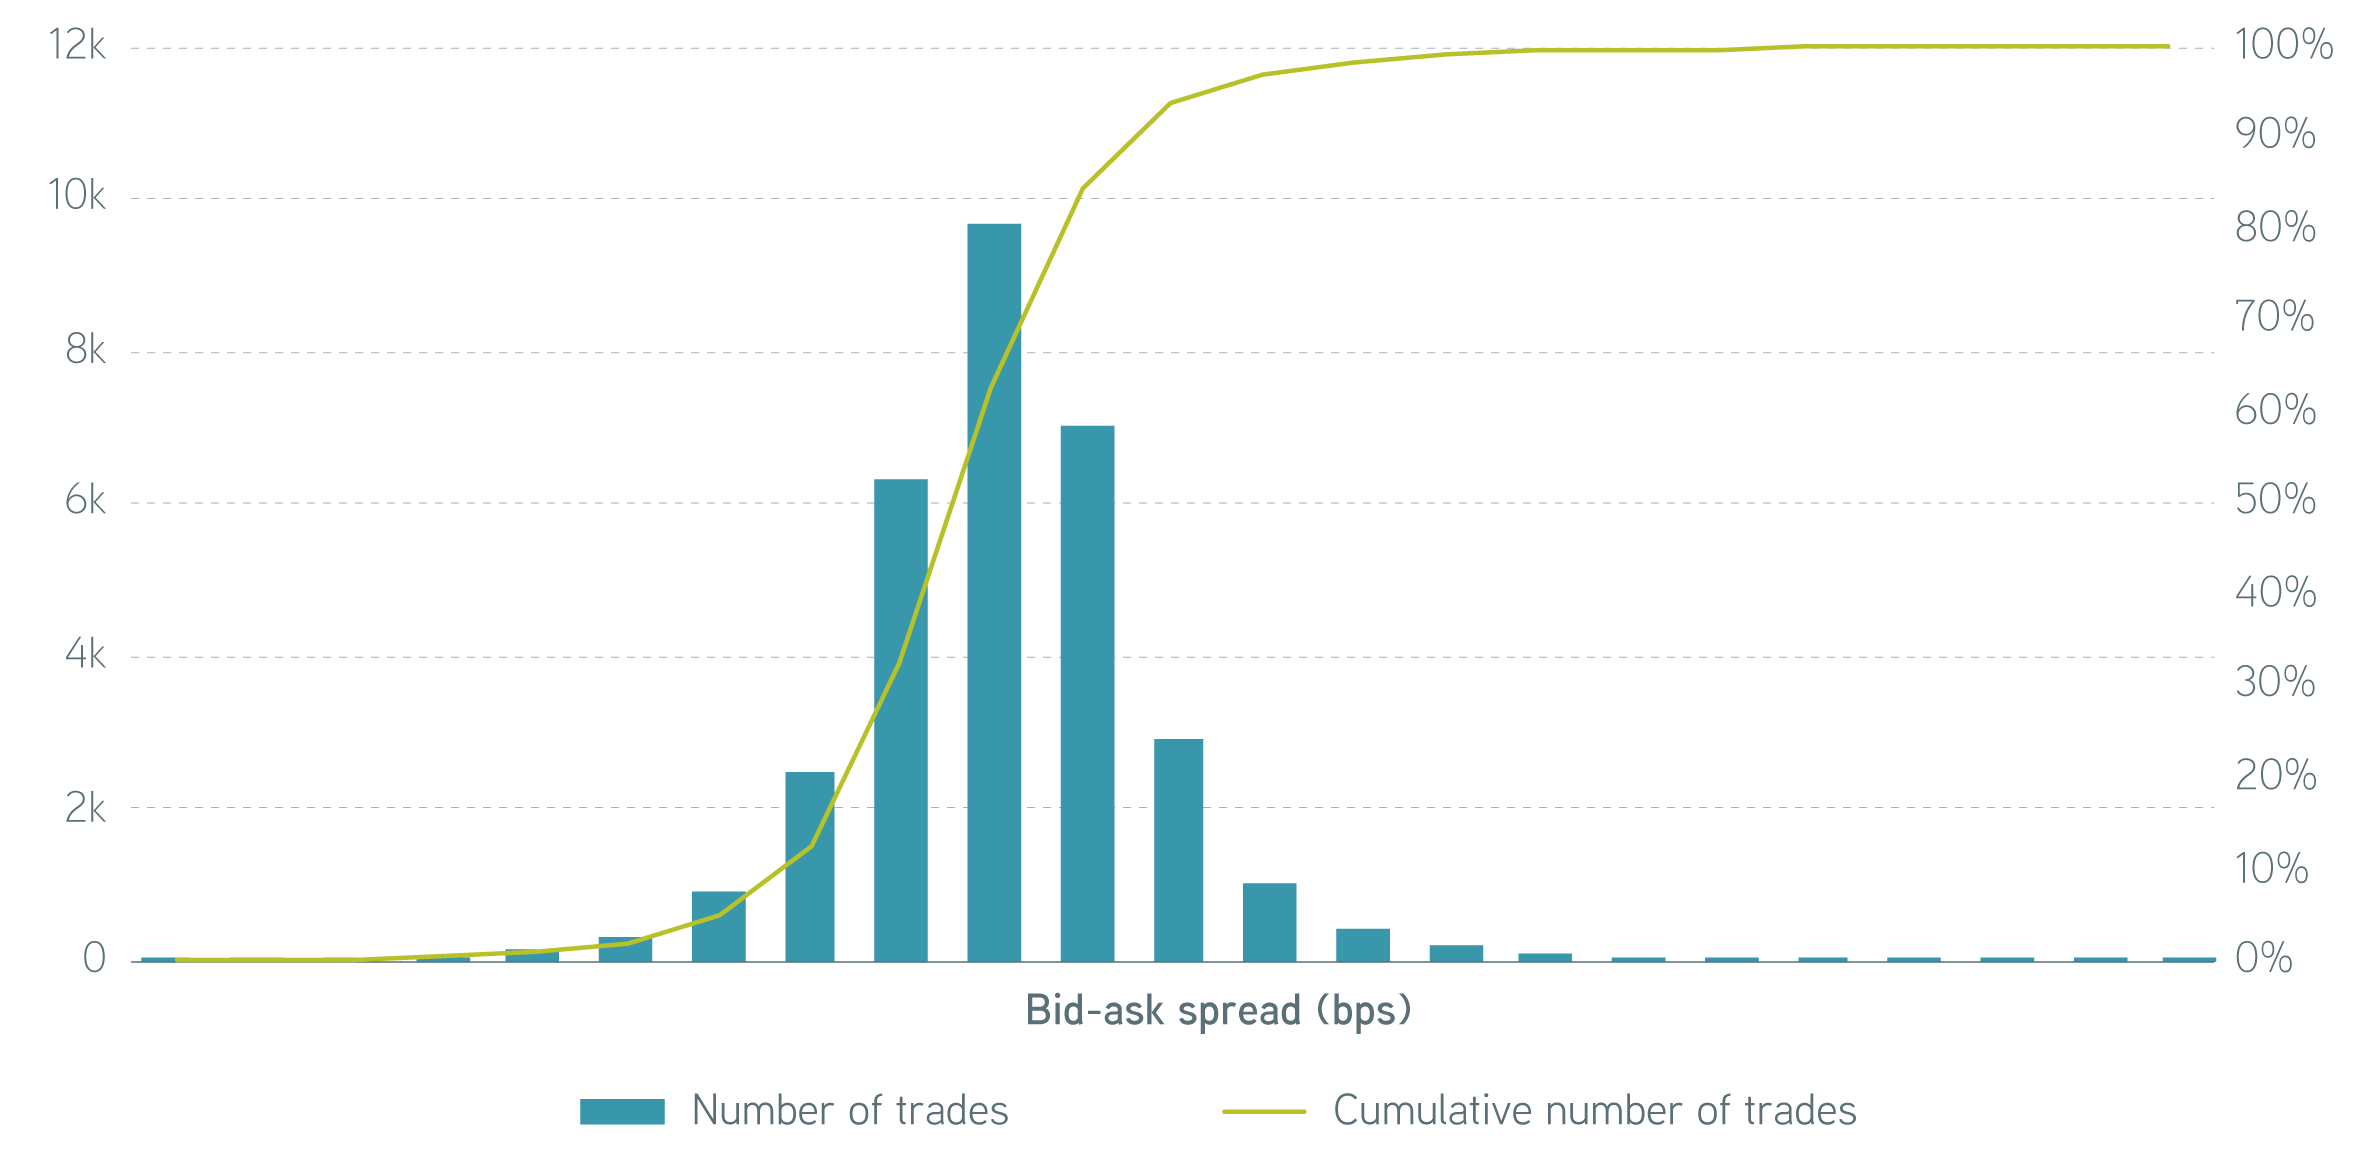
Source: Parametric, 2/7/2022. For illustrative purposes only. Not a recommendation to buy or sell any security. Past performance is not indicative of future results.
The illustration above shows the distribution of corporate bond trades where Parametric bought and sold the same CUSIPs on the same day. We measure a median value of 1.6 bps as the difference between the trade spread for buys and sells of those trades. This is our best estimate of empirical bid-ask spreads for the transactions executed on behalf of our SMA clients—not only far less than the 6.6-bps BASI market average bid-ask spread for micro lots, but even less than the 2.3-bps BASI bid-ask spread for institutional block trades.
Impressively, 15% of observed trade executions were inverted, meaning either the same security was purchased cheaper than it was sold or it sold more expensively than its purchase price on the same day. This shouldn’t occur in efficient markets, where dealers who provide liquidity should be compensated for taking risk. However, the ability to query dozens of counterparties simultaneously, coupled with a trading desk’s experience and market insight, can be a distinct and measurable advantage.
The bottom line
Conventional wisdom holds that the competitive advantage in fixed income trading lies in the ability to aggregate or block small trades into institutional-sized blocks, promoting commingled vehicles and mythical economies of scale that no longer exist. The empirical data from Parametric’s SMA trades strongly refutes that notion. It makes the case that corporate bond investors can take full advantage of the benefits in an SMA, like tax-loss harvesting, without paying additional costs for accessing market liquidity in odd-lot sizes. Following other asset classes like US equities, new trading platforms in the US IG fixed income market have reduced liquidity costs by several orders of magnitude over the past decade through electronification, significantly improving the investor experience.
Special thanks to director of fixed income trading Mike Nappi for his significant contributions to this post.
S&P Dow Jones Indices are a product of S&P Dow Jones Indices LLC (S&P DJI) and have been licensed for use. S&P® and S&P 500® are registered trademarks of S&P DJI. Dow Jones® is a registered trademark of Dow Jones Trademark Holdings LLC (Dow Jones). S&P DJI, Dow Jones, and their respective affiliates do not sponsor, endorse, sell, or promote the strategies described herein, will not have any liability with respect thereto, and do not have any liability for any errors, omissions, or interruptions of the S&P Dow Jones Indices. The index data referenced herein is the property of ICE Data Indices, LLC (ICE) and its affiliates and third-party suppliers. ICE and its affiliates and third-party suppliers accept no liability in connection with its use.