
We analyze the end of this current cycle of rate increases in the fixed income markets. Investigate what Fed actions over the last half century could mean for investors.
While many opinions exist on the timing of the next interest rate cuts, the consensus seems to be that we’re approaching the end of the current rising rate cycle. The fed funds target rate (FDTR) is presently set at 4.75% to 5.00%. December fed funds futures are pricing in three rate cuts to a 4.00% floor. The most recent Federal Open Market Committee (FOMC) dot plot projects a target rate of 5.12% for the end of 2023, declining to 4.25% by the end of 2024. We believe that sometime within the next four quarters, we should see the first rate cut.
Timing the markets can be very difficult to do reliably, so we’ll take a long-term, broad historical look at Fed actions over the last half century. This analysis should provide general guidance to investors on how to approach the fixed income markets as we reach the end of this current cycle of rate increases.
What could the fed funds target rate tell us?
The FDTR has only moved higher for four or more consecutive quarters seven times since 1973. To illustrate these periods, we used the starting time as the end of the last quarter preceding a series of FDTR rate increases. We didn’t set our end when the rate was cut but rather once the rate stopped moving higher.
Fed funds target rate hikes
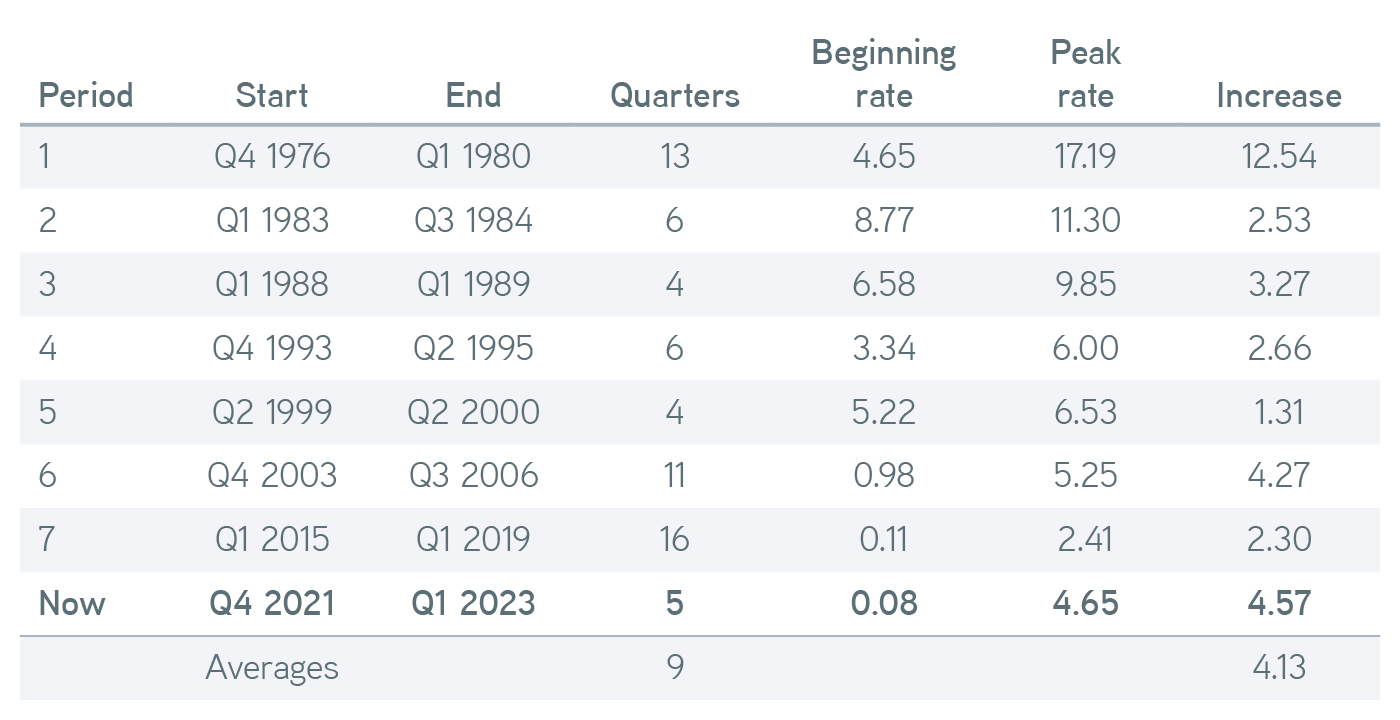
Source: Bloomberg, 4/7/2023. For illustrative purposes only. It is not possible to invest directly in an index.
The average increase over all defined periods in the rate was 4.13%. But this analysis includes the 1970s, a time when the use of monetary policy as an inflation-fighting tool wasn’t common practice yet. Without that instance, the average rate increase was only 2.72%. Today’s inflation is the worst since the early 1980s, and it’s resulted in the largest increase in the FDTR since then. Having defined the periods, we wanted to look at how the markets moved once it became clear that the rate bias shifted.
We looked broadly at where some sectors of the market landed at the end of the quarter immediately following the first one where the FDTR stopped rising, two quarters from the period in which rates peaked. We think this is a worthwhile approach because changes in the FDTR generally don’t occur on quarter ends. Except for September 26, 2018, FOMC meetings haven’t even happened within a few days of a quarter end since 2007. So we think it’s reasonable to use the quarter-end rate as a starting point, assuming that a shift in policy will likely be announced and known to the markets at the end of the quarter if the rate has peaked.
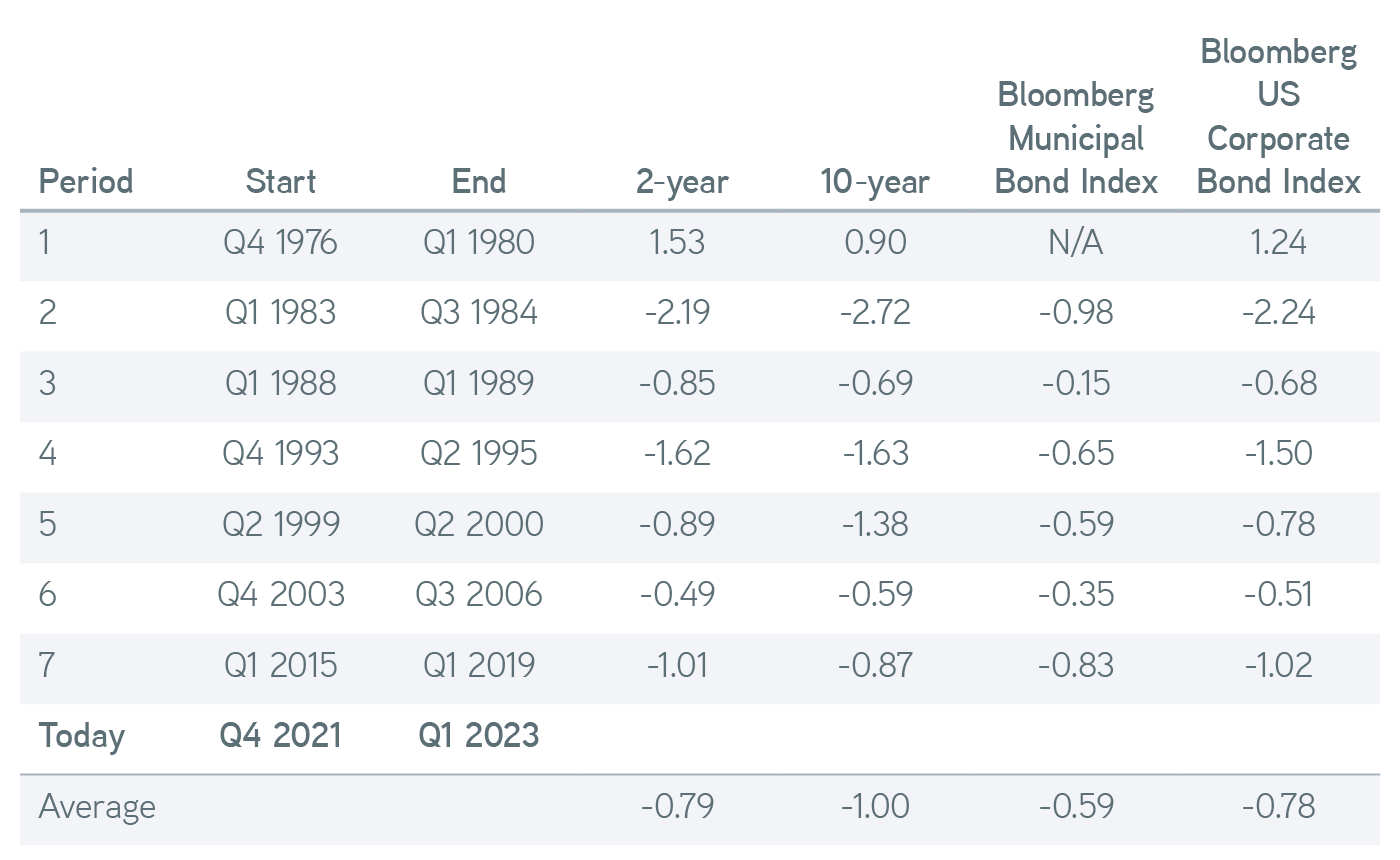
From there we looked at several time periods, but we found two quarters from the peak to be the most compelling. We think this time period is sufficiently out from the shift in policy to see its impact, but it’s not so far out that newer market-moving events would supersede the effects of the Fed. We looked at the change in the yield of the two-year Treasury, the 10-year Treasury, the Bloomberg US Corporate Total Return Value Index, and the Bloomberg Municipal Bond Index from the peak quarter to the end of quarter, two quarters out.
Change in yield of the two- and 10-year Treasury when waiting for quarter-end confirmation
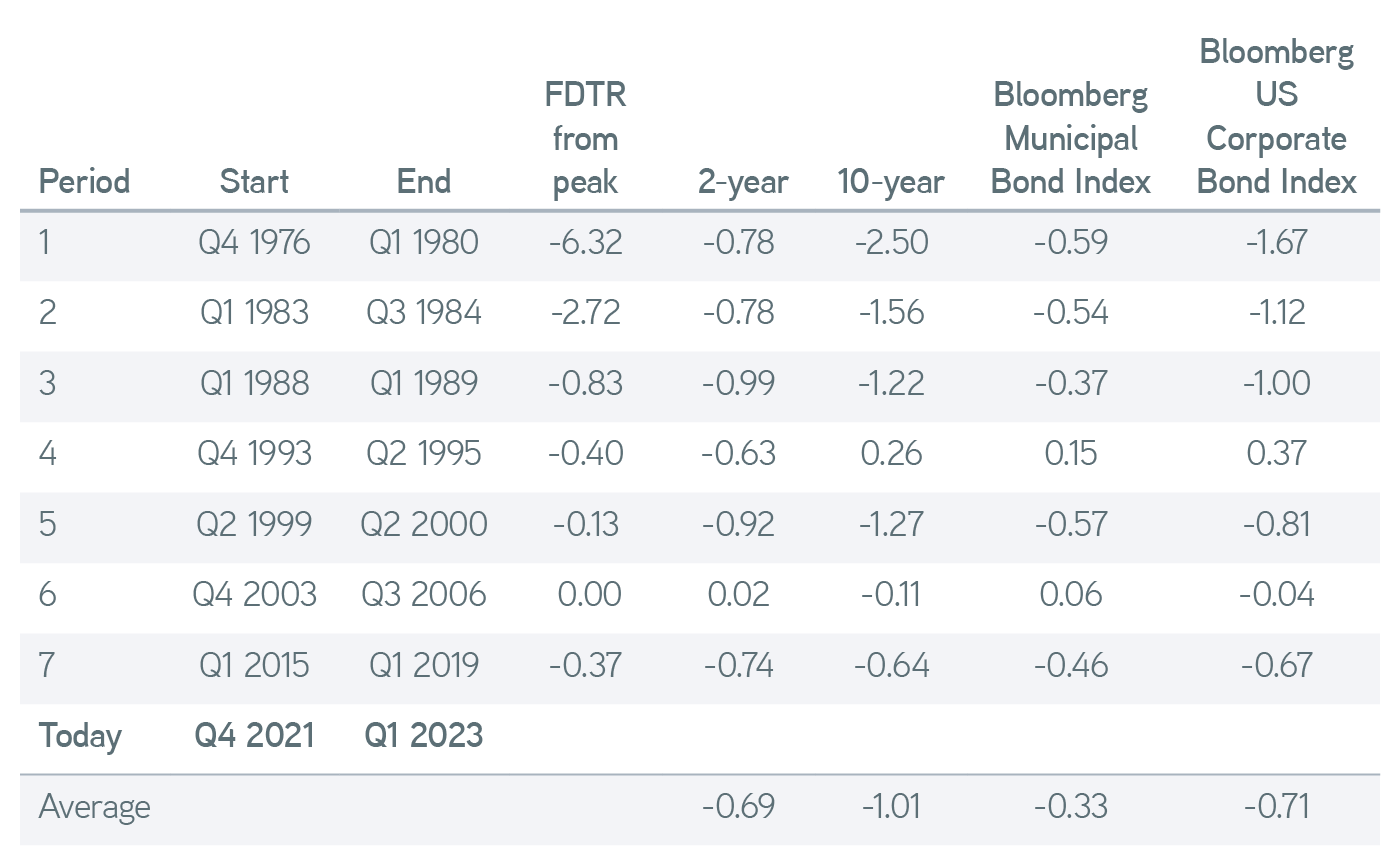
Source: Bloomberg, 4/7/2023. For illustrative purposes only. Not a recommendation to buy or sell any security. It is not possible to invest directly in an index.
On average, yields were significantly lower two quarters after the quarter in which rates peaked. There’s nothing revolutionary here, but it’s noteworthy that the 10-year Treasury meaningfully outperformed the two-year Treasury on a yield basis, an effect which would be magnified in price due to its higher duration. Municipals, corporates, and Treasuries all benefited from the shift in cycle most of the time. We think this makes an argument for adding duration late in the cycle.
Flexible fixed income solutions for turbulent times
Are there advantages to being ahead of the Fed?
There is historical evidence that points to fixed income yield decline after the Fed stops raising rates. Where we think this becomes interesting is when we look at the same chart above but with the rate shift beginning one quarter earlier—essentially, as if we’d correctly anticipated the shift in the rate cycle each time. It may be helpful for investors to get an idea of the potential yield shifts for some guidance relative to curve positioning.
Change in yields assuming correct anticipation
Source: Bloomberg, 4/7/2023. For illustrative purposes only. Not a recommendation to buy or sell any security. It is not possible to invest directly in an index.
What we see here is that the average yield change is only marginally better for our seven periods studied. Being ahead of the Fed didn’t bring significant benefits on average. Keen eyes might notice that this outcome is largely due to the impact of the first period ending in 1980. If we removed that period from both sets of averages, the waiting option (quarter after) generates roughly 57% of the yield change that could have occurred with correct anticipation (quarter before) for both the two-year and the 10-year Treasury. For the municipal and corporate indexes, the waiting option generated around 49% of the performance.
Average waiting vs. anticipating yield change from Q1 1983-Q1 2019
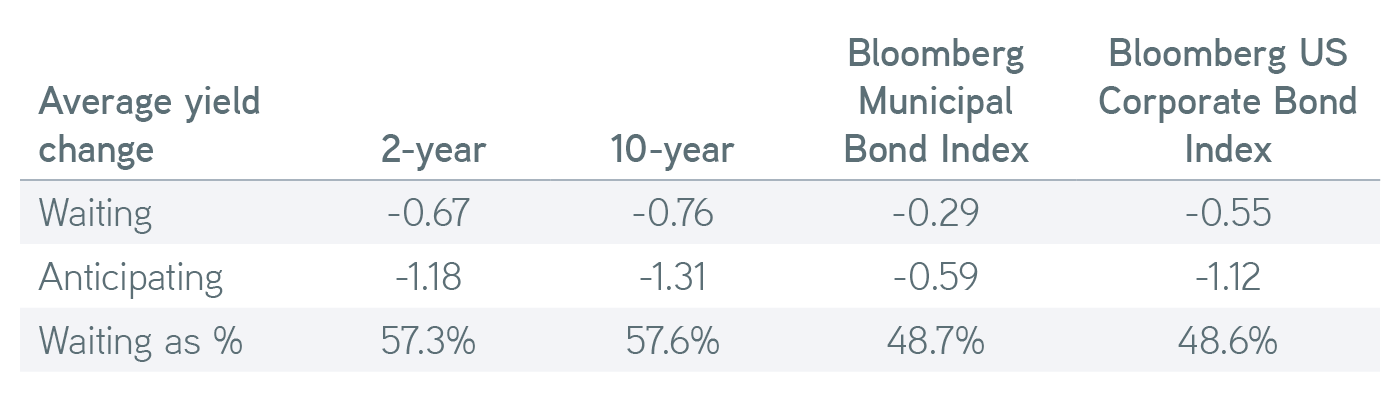
Source: Bloomberg, 4/7/2023. For illustrative purposes only. Not a recommendation to buy or sell any security. It is not possible to invest directly in an index.
We removed the first period above because it seemed to be an outlier. The postpandemic inflation surge was the worst since that period, and the persistence of inflation has some echoes of that time. We don’t anticipate a return to the stagflation of the late 1970s, but it offers a cautionary tale about the risks of trying to anticipate the Fed.
The bottom line
While there are benefits to being ahead of the Fed, simply following its lead has historically delivered strong performance for fixed income investors. Fed guidance on a cycle shift should be clear and well telegraphed, removing any market-timing uncertainty. So we know the end of the rate cycle is coming, but don’t fret anticipating it. Parametric is here as a partner to help guide you through whatever comes.
Bloomberg® is a trademark and service mark of Bloomberg Finance L.P. and its affiliates (collectively “Bloomberg”). Barclays® is a trademark and service mark of Barclays Bank Plc (collectively with its affiliates, “Barclays”), used under license. Bloomberg or Bloomberg’s licensors, including Barclays, own all proprietary rights in the Bloomberg Barclays Indices. Neither Bloomberg nor Barclays approves or endorses this material, or guarantees the accuracy or completeness of any information herein, or makes any warranty, express or implied, as to the results to be obtained therefrom and, to the maximum extent allowed by law, neither shall have any liability or responsibility for injury or damages arising in connection therewith.