

Ten recent hikes have brought the federal funds rate to its highest level since 2007. We believe policymakers will hold rates near current or slightly higher levels while assessing the effects of past rate hikes and the inflation outlook. The peak rate period between the last hike and first cut has historically been a favorable environment for fixed income investors.
In one of the more memorable scenes in the epic film Braveheart, William Wallace skillfully leads his outmatched Scottish warriors against the mighty English army during the Battle of Stirling Bridge. As the opposing soldiers charge toward them, Wallace wisely raises his sword and shouts at his men, “Hold! Hold!,” urging patience to strike at exactly the right moment to maximize the effectiveness of their counterattack. The maneuver proves successful. With the federal funds rate above 5%, will Fed chair Jerome Powell channel his inner William Wallace over the remainder of 2023 and show that same patience? Or will policymakers resume tightening following the pause at the June meeting?
Policymakers are resolved to ensure that inflation will continue decelerating. Despite clear headwinds related to delayed policy effects, potentially less fiscal support following debt ceiling negotiations, and tighter credit in the wake of regional banking distress, we believe inflation and economic strength may remain elevated enough to warrant additional tightening in 2023. Timing and patience are as critical to the Fed today as they were to Wallace on the battlefield. While we expect we’re much closer to the end of the tightening journey than the beginning, the next move will depend on the data. Whether we see additional hikes or not, we believe we’re near the peak Fed funds rate, which will be followed by an extended hold period. Historically, this hold period between the last hike and the first cut has been favorable for bond investors.
Why might policymakers keep interest rates on hold?
By many measures, the Fed has accomplished its goal of bringing policy into sufficiently restrictive territory. Real yields have moved into positive territory, and the current fed funds rate of 5.1% is well over the Fed’s median long-term neutral rate of 2.50%. Growth is slowing, and the Federal Open Market Committee (FOMC) predicts it will move below trend. However, policymakers are keeping a keen watch on stubbornly elevated inflation and a strong labor market. As a result, Powell stated the Fed’s “talking about a couple of years out” for rate cuts.
At last week’s June FOMC meeting, Powell stated the risks to inflation remain to the upside. Although we’re witnessing a deflationary trend where the headline number has slowed for 10 consecutive months, the Fed’s own projections call for a core personal consumption expenditures (PCE) index reading of 3.9% at year’s end and 2.6% by 2024, still above their 2% target. Over the last five hiking cycles, as the Fed started cutting rates, the core PCE averaged 2.8%; it now stands at 5%. It’s clear the Fed wants to see inflation come down further before reversing course.
Another factor likely to keep the Fed on hold for longer is the solid employment picture. With the unemployment rate at 3.4%—a 60-year low—and elevated wage growth of 4% to 5%, the labor market is still hotter than the Fed would deem necessary to cool price pressures. The number of job openings has fallen to 10 million, down from 12 million openings reported in March 2022. But a ratio of job openings to unemployed persons of 1.8 is still well above what we’d see in a labor market with adequate slack to limit wage growth.
How is the peak-rate hold period potentially favorable for fixed income?
As Evan Rourke recently wrote, over previous tightening cycles, yields have tended to decline during the peak-rate hold period from the last hike to the first rate cut. We believe that’s where we stand today. Looking back over the past five tightening cycles going back to 1989, the average time between the last hike and first cut was 232 days. On average, the 10-year US Treasury yield fell 1.07% over those peak rates periods. The two-year Treasury fell 1.4%, causing the curve to steepen. Broad-market Treasuries, municipal, and corporate indexes saw positive performance of 6.67%, 6.64%, and 8.2%, respectively.
Solutions for today’s complex interest rate environments
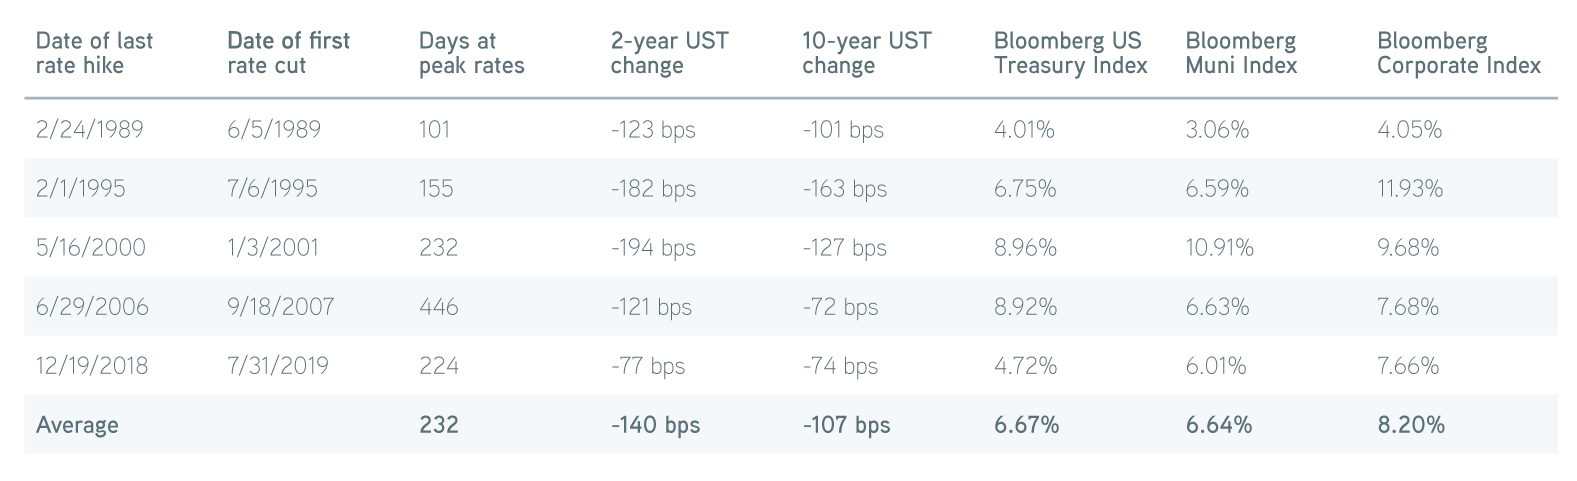
Source: Bloomberg, 12/31/2022 For illustrative purposes only. Not a recommendation to buy or sell any security. It is not possible to invest directly in an index. Past performance is no guarantee of future results.
We expect the second half of 2023 to be a favorable environment for fixed income investors. The combination of restrictive policy, credit tightening, and potentially reduced fiscal support should keep a lid on interest rates as growth slows and inflation moves slowly back to the Fed’s target. While income on cash sweeps, CDs, and T-bills seem attractive, we favor extending out on the curve to lock in rates. The economic cycle is at the stage where we recommend adding some duration in a portfolio, especially as recession risks mount. The Bloomberg median forecast for the 10-year Treasury yield at year’s end is 3.4%, 30 bps below the yield at the time of this writing. Our Laddered Interest Rate Scenario Tool can help show how muni, corporate, and Treasury portfolios might perform if rates decline over the year ahead.
How will munis and corporates fare in the second half of 2023?
The muni and corporate bond markets should both remain well supported by strong credit fundamentals and favorable supply-and-demand technicals. Muni credit is solid, with the asset class well prepared for a mild recession. States are entering this slowdown with elevated reserves, two years of better-than-expected tax receipts, and lingering support from federal aid allocated from 2020 to 2021. States’ total rainy-day funds stood at $132 billion to start the year, according to JP Morgan—three times what they had heading into the financial crisis and twice what they had heading into the COVID recession. Finally, rating activity remains positive; S&P upgrades have outpaced downgrades by 2.7 times to start the year.
Demand for tax exemption is strong. Tax-free yields in the 3%-to-4% range—a decade-plus high—are keeping buyers engaged. The muni market is heading into the summer months when we expect more dollars chasing fewer bonds. Estimated principal and coupon redemptions for June through August according to Bloomberg are a staggering $121 billion. With new-issue muni supply down 20% year over year, net negative supply is expected to be $33 billion, again according to Bloomberg. This will likely drive strong relative performance for the asset class. Despite renewed interest from investors buying individual bonds and SMAs, mutual funds continue to see outflow, with $8.5 billion in outflows year to date, according to Lipper. This is on the back of a record $120 billion of outflows in 2022. We believe muni fund flows will turn positive in the second half of the year, giving additional support to an already strong demand picture.
Investment-grade (IG) corporate bond yields continue to entice. Unlike in the muni space, investors have responded positively to corporate bond yields exceeding 5%, their highest level in almost 14 years. So far in 2023, IG funds have seen $88 billion of inflows, according to JPMorgan. The yield on the ICE BofA 1–10 US Corporate Index stands at a compelling 5.4%, almost 10% higher than the yield during the March 2020 pandemic sell-off and near levels we haven’t seen since 2009. Viewed within the context of a ladder investment, the current yield is even more attractive. The yield on an A-rated one- to 10-year ladder with a 4.6-year duration now exceeds 4.8%. A similar minimum BBB one- to 10-year ladder is above 5.3%. Importantly, we believe the starting yield offers sufficient cushion for an A-rated one- to 10-year ladder to withstand a 1.25% rate increase rates and still produce a breakeven return over the next year.
Like those of state and local governments, we continue to view the balance sheets of IG companies as solid heading into a potential economic slowdown. IG corporates continue to manage their balance sheets conservatively. Corporate management maintains its focus on controlling expenses, and margins continue to improve. Downgrades are increasing from a low level, and upgrades are more than offsetting their impact.
The bottom line
Like William Wallace, Powell and other policymakers are likely to ”Hold! Hold!“ rates near current or slightly higher levels as they assess the effects of past rate hikes and the inflation outlook. A slowing economy and the eventual cooling of inflation should keep a lid on interest rates between now and the next recession. While we might see further tightening later this year, our expectation is that we’re near the peak rate period between the last hike and the first cut, historically a favorable environment for fixed income investors. We recommend extending on the curve, locking in yields, and including some duration in a portfolio.