

Want to add commodities to your portfolio? Investors may not get what they need from index-based products. We explore two big pitfalls.
Commodity investing is experiencing a resurgence of interest following what has been the highest level of inflation in more than 40 years and the lack of protection from the classic 60/40 portfolio. With inflation expected to come down only gradually to the US Federal Reserve’s 2% target over the next couple of years—and with a lot of uncertainty in that forecast—the case for owning commodities within a diversified portfolio remains very strong in our opinion.
After making the decision to invest in the asset class, many investors might point to an index-based product as a sensible way of gaining exposure. Their reasoning is that an index product should give them an experience similar to what they’re used to in equity markets, where a passive vehicle represents an unbiased slice of the market. In reality, due to the quirky nature of how commodity indexes are put together, investors may not get what they signed up for. To make matters worse, they may even miss out on one potential source of return. We explore what passive investing really looks like in the commodity space and suggest simple solutions that seek to benefit from the asset class’s unique characteristics.
Why are the risk-return profiles of popular commodity indexes so different?
As commodity investing has become more popular, three benchmarks have attracted the majority of passive assets: the S&P Goldman Sachs Commodity Index (S&P GSCI), the Bloomberg Commodity Index (BCOM), and the Dow Jones Commodity Index (DJCI). An initial misconception arises around what these indexes actually measure. To be clear, they don’t represent the returns of either equities or physical commodities. Though mining, energy, and agriculture stocks certainly have a commodity component to their returns, broader swings in the stock market can overwhelm their underlying commodity exposures. On the other hand, physical commodity holdings can also prove problematic for most investors because of the need to transport and store the raw materials. Most of us don’t have the necessary space to stash 100 barrels of oil or the land to raise a herd of cattle.
For those reasons, index providers have decided to base their exposures on fully collateralized commodity futures positions, in which prices of the futures are derived from the underlying commodity. Given that all three indexes are put forward as describing the broader commodity asset class, some odd facts surface when we dig a little deeper into their risk and return characteristics.
Diversify beyond stocks and bonds
Commodity index risk-return profiles, December 2017–November 2022
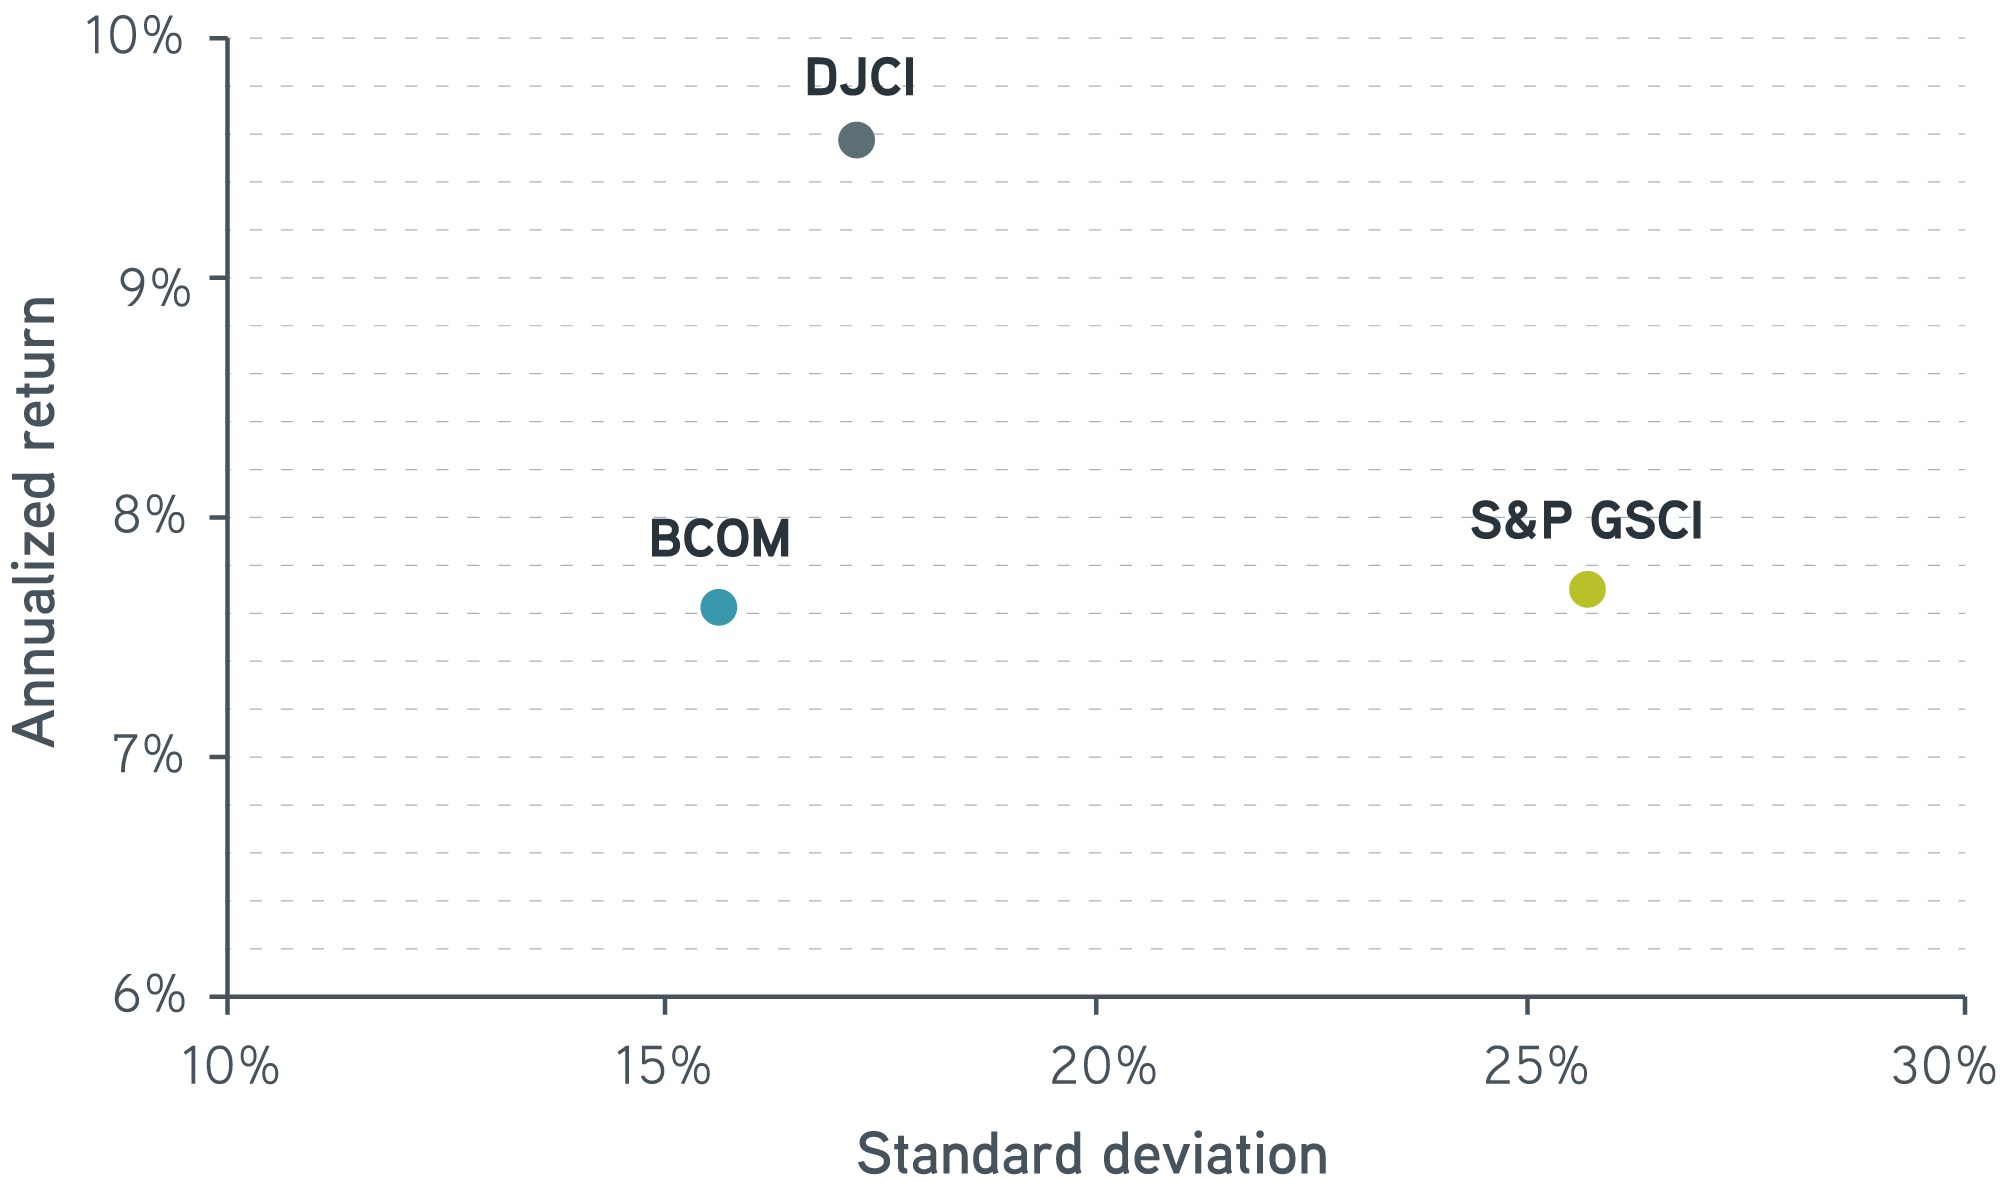
Sources: Parametric, Bloomberg, 11/30/2022. For illustrative purposes only. Past performance is not indicative of future results. Not a recommendation to buy or sell any security. It is not possible to invest directly in an index.
Over the past five years, we see dramatically different values for these metrics, ranging from an annualized return of 7.6% for BCOM to 9.5% for DJCI, while volatility swings from a hair over 15% (BCOM) to well over 25% (S&P GSCI). For comparison, if you were to plot the five-year annualized returns and standard deviations for the S&P 500® and the Russell 1000, two common US large-cap equity indexes, you’d find very little deviation in their performance or risk. The annualized five-year return for the S&P 500® was 11.0% versus 10.7% for the Russell 1000. Volatility was also very similar between the pair, with the annualized standard deviation measuring 18.4% for the S&P 500® versus 18.7% for the Russell 1000.
To understand what’s going on in commodities, we can find our first hint by looking at the underlying sector exposures within each index, which reveal noticeably different weights to the major groupings.
Commodity index sector weights as of 11/30/2022
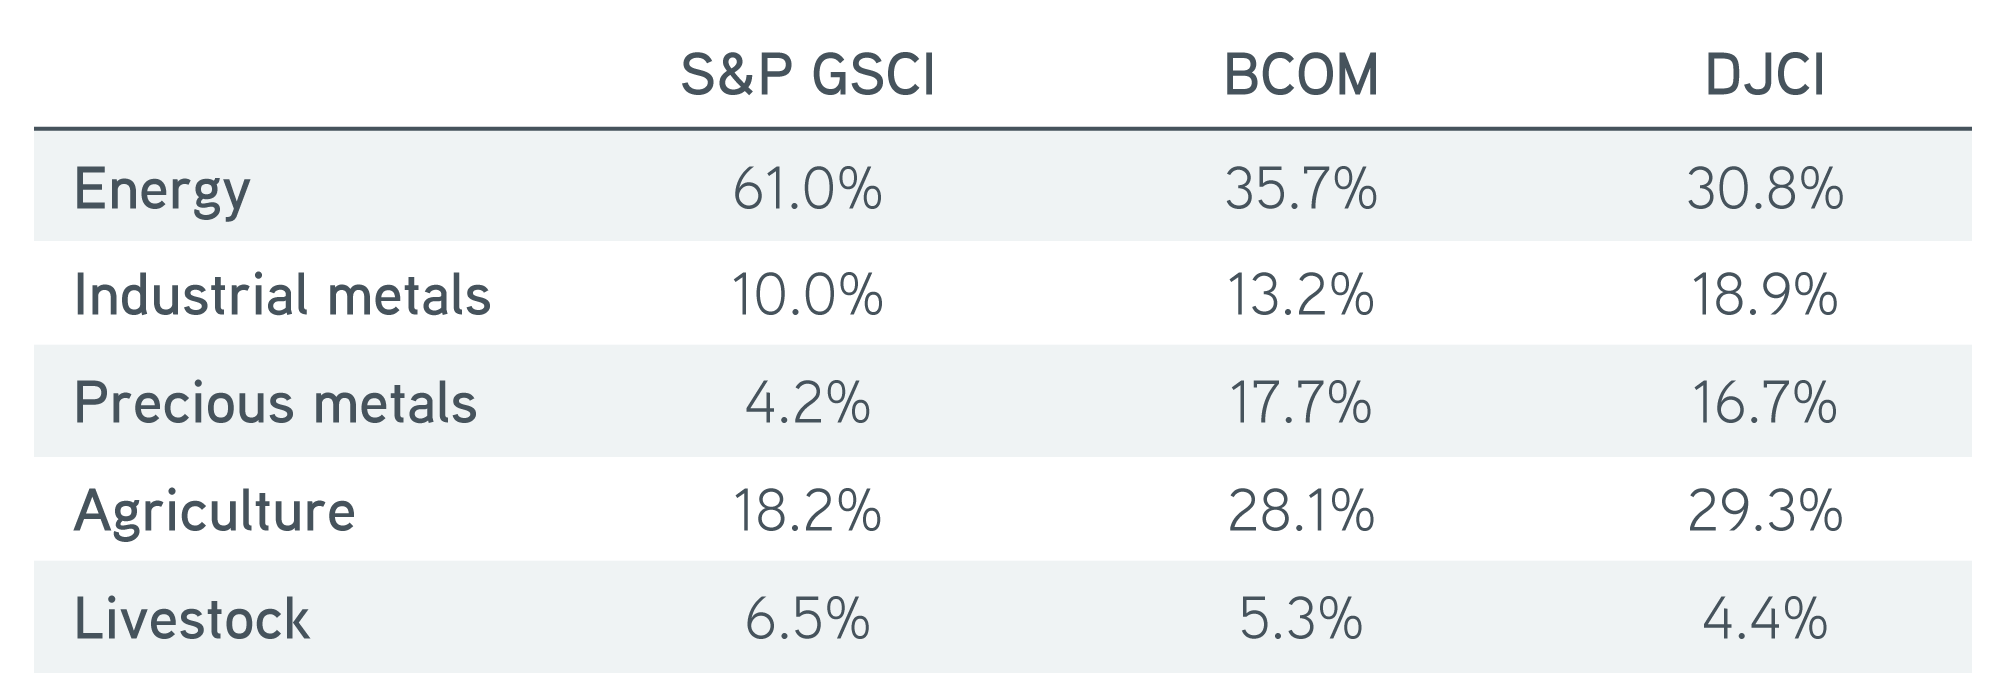
Sources: Parametric, Bloomberg, 11/30/2022. For illustrative purposes only. Not a recommendation to buy or sell any security. It is not possible to invest directly in an index.
Here’s where the uniqueness of commodity indexes being based on futures contracts, and not physical commodities, comes to bear. Whenever an investor buys a futures contract, another market participant simultaneously sells an equal and offsetting position. This is a construction feature that allows the establishment of a futures market in a commodity to balance supply and demand without having a major impact on prices in the spot market for that commodity. However, due to this structure, the concept of market capitalization breaks down because all contracts have zero market cap.
In a sense, there are no natural market weights for the constituents in a commodity index. Needing a consistent weighting mechanism, index providers developed a variety of supposed proxies to play a similar role in their indexes. These include global production for S&P GSCI, economic significance for BCOM, and liquidity for DJCI. Ultimately there’s no clear argument that any one of these proxies is better than another. What becomes apparent, though, is that these indexes function more as commodity-trading strategies than passive slices of the market. Of even greater concern, their weighting schemes tend to create sizable concentrations in one or two sectors and consequently more volatile investment outcomes. Investors looking for a smoother ride in the asset class may find emphasizing diversification across commodities to be one potential solution.
Are commodity index investors missing out on returns?
Another feature of commodity indexes worth examining relates to the rules governing rebalancing. The major commodity indexes generally recalculate and rebalance their respective asset weightings once per year and trade to the new weights in early January. This annual process is suboptimal in our view, given the nature of commodity price swings.
First, commodities have a well-earned reputation for experiencing high levels of volatility over even very short time periods. This volatility results from the intrinsic link of commodity prices to risks such as political turmoil, weather conditions, and other factors resulting from uncertain supply and demand. Second, the commodity asset class represents a set of disparate physical commodities that share very little in terms of common return drivers. For example, there’s little that connects the price of corn to the price of aluminum. As a result, we see very low to negative levels of correlation across the complex.
Taken together, the expected benefit from rebalancing more frequently—monthly or quarterly, for example—should be meaningful. Commodity prices certainly do tend to overreact in the short term, meaning opportunities to rebalance present themselves regularly. Take the experience of an oil investor throughout the 2020 COVID-19 crisis. West Texas Intermediate (WTI) crude prices fell to an unfathomable -$37 per barrel in April 2020, down from $61 per barrel at the start of the year. From there prices went on to rally nearly $90 per barrel through year end. An investor who held a static crude position during this cycle would have experienced a cumulative return of approximately -50%. However, an investor who rebalanced by buying into price weakness would have effectively increased their exposure to crude, positioning themselves to better capitalize on the subsequent price recovery. Rebalancing methodologies that allow portfolio weights to drift freely with prices within a given year risk missing out on these opportunities, ultimately to the detriment of the investor.
The bottom line
Investors face several challenges when attempting to gain passive market exposure in the commodity asset class. While market-cap-weighted indexes in equities give a reasonable approximation of the opportunity set for an investor, there’s no equivalent weighting scheme that will create a similar portfolio in commodities. This means mainstream commodity indexes fail to provide what most investors would consider a passive exposure to the asset class. Rather, the construction rules yield substantial concentrations, and inefficient rebalancing rules may cause missed opportunities. Investors and advisors should be aware of these pitfalls the industry has created and find ways to mitigate them when making investment decisions.
The value of commodity investments will generally be affected by overall market movements and factors specific to a particular industry or commodity, which may include weather, embargoes, tariffs, and health, political, international, and regulatory developments. Economic events and other events (whether real or perceived) can reduce the demand for commodities, which may reduce market prices and cause their value to fall. The use of derivatives can lead to losses or adverse movements in the price or value of the asset, index, rate, or instrument underlying a derivative due to failure of a counterparty or due to tax or regulatory constraints.