

Plan sponsors may be in a better position than ever to preserve funded status. But as corporate pensions reach historic funding levels, yield curve inversion brings important considerations. We discuss retooling pensions to mitigate risk in this environment.
Corporate pensions have reached funded status levels that we haven’t seen since prior to the 2008 global financial crisis (GFC). Plan sponsors have enjoyed a marked improvement in funded status over the past two years. As we called out in our 2023 LDI outlook, this might come as a pleasant surprise given returns that looked abysmal in 2022 through an asset-only lens. But the picture becomes clearer when viewed from a total-portfolio perspective.
However, these market dynamics can also work in reverse. It’s important to take note of key residual risks as plan sponsors approach an inflection point of pension de-risking. One of these risks is the yield curve, and turmoil induced by events in regional banking have shown just how volatile this factor can be. Let’s look at why this current yield curve environment makes it more important to closely review the composition of liability-hedging assets.
Exploring the historic yield inversion
Investors don’t have to look far for market commentary about the state of today’s yield curve. Economic and market prognosticators broadly look at yield curve inversion as a recession indicator. Based on the 2s10s Treasury spread, the extent of this year’s inversion has been greater at times than levels experienced during the lead-up to the dot-com bubble and the GFC. Many factors related to the COVID-19 pandemic led to the Fed moving rapidly in 2022 to preserve the economy against accelerating inflation. Recent regional banking unrest may lead to tighter credit conditions even though economic data releases have indicated that inflation remains stubbornly high, and it may lower the Fed’s terminal rate.
Treasury yield curve from 1992-2022
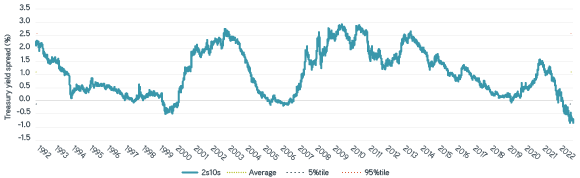
Sources: Bloomberg, Parametric, 3/8/2023. For illustrative purposes only.
Considering adjustments for hedging resiliency
Plans sponsors have acted to de-risk against the backdrop of higher rates and improved funded status, often following a regimented glide path to move return-seeking assets to a liability-hedging bucket. This maneuver is a powerful way to reduce surplus volatility and preserve precious gains to funded status. But we think plan sponsors should begin to review the composition of these liability-hedging assets in the context of the current environment.
Liability-hedging assets consisted largely of long credit and STRIPS throughout the 2010s. This allocation was a capital-efficient one: Long-duration assets allowed plan sponsors to maintain a reasonable—albeit still under-hedged—interest rate hedge ratio while keeping a hearty portion of return-seeking assets.
Funded statuses are at levels not seen since prior to the GFC. Given this backdrop, pensions may be on a path toward hibernation or eventual risk transfer, with plan sponsors seeking to reduce their allocation to growth assets and build out diversified liability-hedging buckets. Long credit and STRIPS may no longer be the only liability-hedging tools in this context.
Measuring pension curve risk
It’s helpful to break down both the liability and corresponding hedging assets into key rate durations to illustrate the potential impact of the yield curve. This analysis produces a straightforward visual of over- and under-hedging across the yield curve. While each pension is special, we’ve provided an illustration below for what a key rate profile might look like using only long credit and STRIPS.
Allocations of long credit and STRIPS
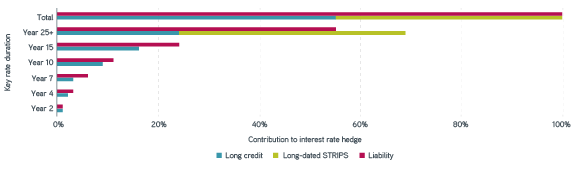
Sources: Parametric, Bloomberg, ICE, 3/8/2023. Outcomes reflect Bloomberg US Long Credit (70%) and Bloomberg US 25+ Year Strips (30%). It is not possible to invest directly in an index. The asset/liability outcomes are based on risk metrics that change over time. They are for illustrative purposes only. No representation is being made that actual outcomes based on plan attributes and live markets would be similar to those demonstrated.
Now imagine a scenario where the yield curve steepens—that is, uninverts. An over-hedge at the long end of the curve could produce a loss in surplus in cases like that. That’s precisely what plan sponsors seek to avoid. Recent turmoil in some regional banks has demonstrated just how real of a risk this can be. The 2s10s inversion moved nearly 70 basis points (bps) between March 7 and March 24. And on March 14, the MOVE Index, an indicator of interest rate volatility, hit a high not seen since 2008.
It's important to note that this exercise is primarily one of risk management. We don’t claim to have any special insight into how and when the yield curve might return to its “normal” shape. But given the combined impact of improved funded status, subsequent de-risking, and current market dynamics, the measurement of this residual risk is of heightened importance.
Seek the right balance in pension liability hedging
How to retool the hedging portfolio
There are several ways that plan sponsors can move to mitigate curve risk. The goal is to migrate asset key rate duration exposure away from the long end of the curve and toward the intermediate spectrum. In some cases the first step is to add or increase an allocation to intermediate credit. It’s possible that this change alone could be sufficient to mitigate curve risk if the de-risking step is large enough to merit significantly larger allocations to hedging assets.
In many cases plan sponsors may want to use a more nuanced approach. For instance, allocating to intermediate credit might leave the pension liability under-hedged on an interest rate basis. Plan sponsors that make efforts to diversify credit exposure into areas such as private debt may find themselves in a similar position. A more curve-optimal approach may be to migrate a STRIPS portfolio to an LDI completion sleeve with the intent of customizing the sub-portfolio of liability-hedging assets to fill remaining key rate duration gaps using a combination of physical Treasuries and synthetic overlay. A cash-flow-matching corporate bond ladder may also be a useful complement to a well-diversified portfolio of liability-hedging assets in an end-state portfolio.
LDI completion sleeves along the yield curve
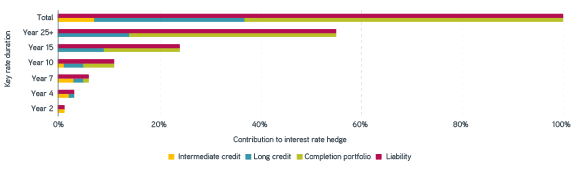
Sources: Parametric, Bloomberg, ICE, 3/8/2023. Does not represent actual attributes of any portfolio. Outcomes reflect Bloomberg US Intermediate Credit (35%) and Bloomberg US Long Credit (40%), with the completion portfolio derived by completing a target 100% hedge ratio. It is not possible to invest directly in an index. The asset/liability outcomes are based on risk metrics that change over time. For illustrative purposes only. No representation is being made that actual outcomes based on plan attributes and live markets would be similar to those demonstrated.
The bottom line
A lot has changed in only two years’ time, and recent events have demonstrated how quickly some factors can reverse course. Corporate pensions may be in a better position than ever to preserve funded status. The meeting of this pension inflection point and today’s yield curve environment lead to an opportunity to mitigate risks that have so far been secondary to other objectives. As plan sponsors take a closer look at retooling their hedging assets, custom LDI completion sleeves can play an increasingly important role in pension risk management.