

Watching the fed funds rate cycle has been an adventure that’s left many investors thinking about the peak. We believe it could be worth locking in tax-exempt municipal bond yields before time runs out.
The Federal Reserve is continuing what appears to be the final leg of its expedition toward the peak fed funds rate of this cycle. Tax-exempt benchmark muni yields are sustained at 14-year highs and almost 100 basis points higher across the curve since the start of the year. Relative value is also compelling beyond 10-year maturities, at 72%, 81%, 81%, and 89% of corresponding US Treasuries for 10-, 15-, 20-, and 30-year maturities, respectively. And you don’t need to go all the way out on the curve—the 20-year maturity captures 96% of the 30-year yield. Historically speaking, there may be good reasons to add duration now: Tax-exempt munis have outperformed T-bills in the 12- and 24-month periods following four of the five most recent hiking cycles.
Today’s higher yields mitigate the prospect of further material losses following almost two years of rising rates, as well as offering opportunities for tax-loss harvesting. We believe a compelling entry point has emerged, although there are of course risks involved with any adventure. Municipal market participants, prospective buyers, and otherwise fully invested spectators might find it better to spend time thinking about the fixed income landscape that’s already in view, rather than waiting for the peak. We’re now at great heights in yield, and it’s okay to look down. It’s still possible that the slope on the opposite side of the summit may turn out to be steeper than currently anticipated.
What does the yield curve inversion mean for investors?
The speed and magnitude of this hiking cycle has kept fixed income yield curves inverted, with short-term rates eclipsing long-term rates for the last 14 months. But not all inversions are equal. The high-profile US Treasury yield curve is materially different and more severely inverted than the lesser-known AAA benchmark municipal yield curve. This is where investors should make a deeper examination of the tax-exempt landscape.
AAA muni vs. US Treasury yield curve
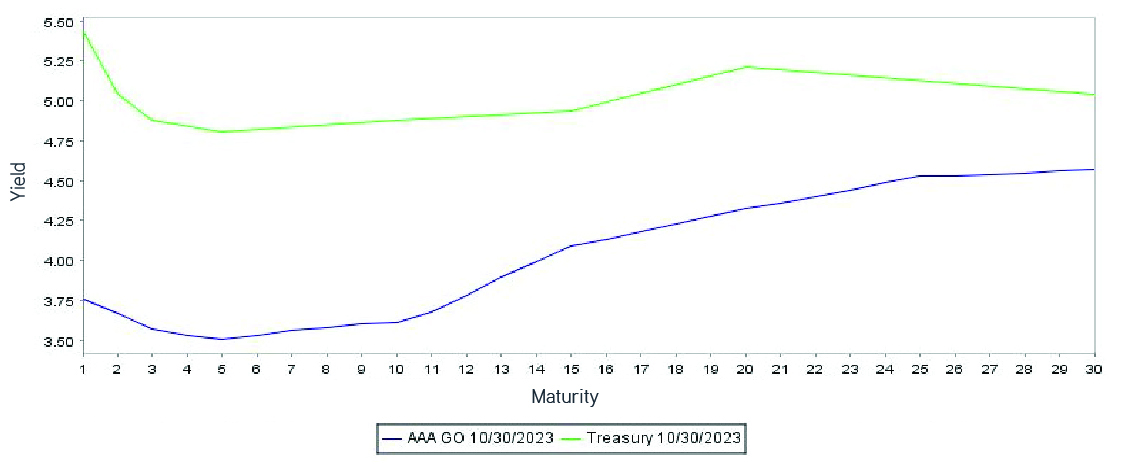
Source: Refinitiv MMD, 10/19/2023. For illustrative purposes only. Not a recommendation to buy or sell any security.
The Treasury curve is fully inverted throughout the 30-year maturity spectrum, while the muni curve is inverted to less than halfway along it, specifically to the 12th year, and to a lesser degree. Elevated yields in the shortest maturities for both Treasuries and tax-exempt munis are enticing to many investors. However, the positively sloped curve of munis suggests that investors might be well rewarded if they lock in today’s high intermediate-to-longer yields, given the expectations of moderating or slowing US economic growth.
But how high are prevailing muni yields versus historic levels? How might they react when the Fed ceases its hiking cycle, or even begins to cut rates? Benchmark muni yields across the curve have been lower than today’s levels the vast majority of time over the last 15 years. In fact, five-, 10-, and 20-year maturity yields have been lower (more expensive) than they are today 97%, 86%, and 78% of the time, respectively, according to Refinitiv MMD. Additionally, longer-duration muni and corporate indexes also outperformed a shorter three-month US Treasury bill index over 12-month and 24-month periods following the last rate hike in four of the last rate-hiking cycles.
Muni and corporate vs. ICE BofA US 3-Month Treasury Bill Index performance
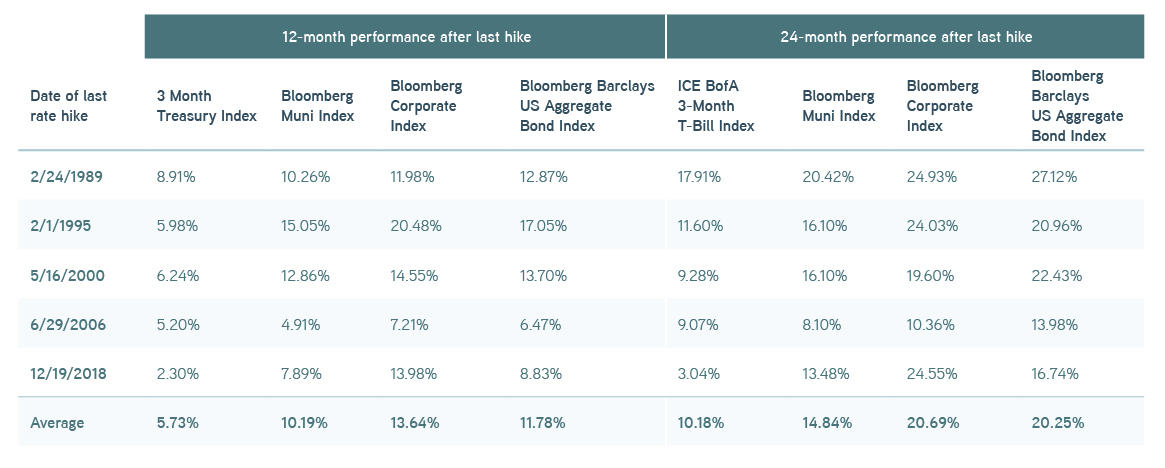
Source: Bloomberg, 10/19/2023. For illustrative purposes only. Not a recommendation to buy or sell any security. It is not possible to invest directly in an index. Indexes are unmanaged and do not reflect the deduction of fees or expenses.
Solutions for today’s complex interest rate environments
Why buy munis now?
Market watchers discuss the Fed and interest rates constantly, but they rarely address the seasonality of tax-exempt munis. Seasonality is a key point for investors interested in buying munis. Both new-issue supply and organic reinvestment demand from coupons, called bonds, and maturing bonds ebb and flow throughout the year, but they’re rarely equally balanced. Some months have an excess of new supply versus reinvestment demand, or net positive supply. Some months also have the opposite occur, where reinvestment demand outweighs new supply, or net negative supply. External factors, like mutual fund flows and investors buying or selling bonds, can skew these monthly landscapes. But the seasonality does tend to assert itself, and we can often see it by following the relative value ratios of munis versus US Treasuries.
We’re currently in a season of net positive supply, and mutual fund outflows are adding secondary supply to the market. Given the year-to-date losses in munis, tax-loss harvesting exacerbates the supply picture and further weighs on bond prices, but in an orderly fashion. This imbalance of greater supply and weaker demand has placed downward pressure on muni bond prices—precisely at a time when yields have already risen due to market concerns over additional rate hikes.
The combined impact of these factors has driven benchmark muni yields to their highest levels in 14 years and muni-to-Treasury relative value to its year-to-date highs. We don’t expect this confluence of buyer-friendly technicals to last, since reinvestment demand tends to increase during December and January, while new-issue supply typically slows. This reversal will very likely close the current window. Last-minute tax-loss harvesting in December may also contribute to choppy markets and related liquidity challenges for those trying to access the market at the end of the year.
Muni vs. US Treasury relative value, Jan. 2023–Oct. 2023
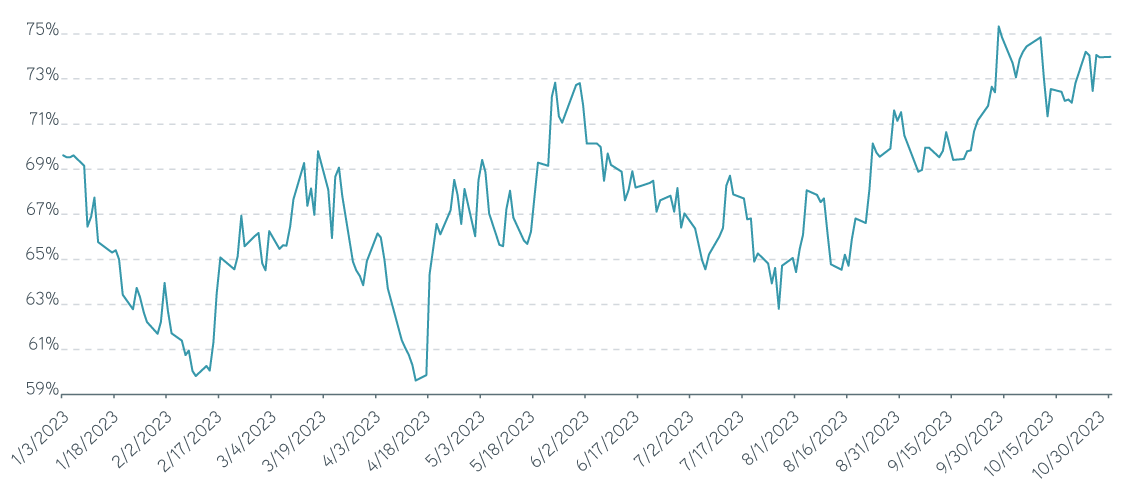
Source: Refinitiv MMD, 10/19/2023. For illustrative purposes only. Not a recommendation to buy or sell any security.
The bottom line
We believe investors have a window to enter the tax-exempt muni market in a high-quality fashion, with an eye toward locking in prevailing yields in the intermediate-to-long part of the yield curve. We don’t expect this opportunity to endure beyond mid-November. Buyers interested in adding tax-exempt municipal bonds should take notice, despite the market’s current fascination with the higher-for-longer narrative.