
Either a deal or a default on the debt ceiling could create significant market volatility. Every investor should know to expect ups and downs—but they rarely know which will come when. Can your portfolio react quickly enough? Learn how systematic exposure adjustment can help.
With a battle over the federal debt ceiling looming, potentially culminating in a default on US government debt, it’s crucial for investors sensitive to market shocks to have a plan in place. Of course, it’s impossible to foresee exactly how that battle will play out. But investors should be attuned to the possibility that risk levels in equity-heavy allocations could skyrocket if a default occurs.
How should we think about the outsized risk associated with holding equities? And how might we determine the appropriate action to take to bring risk back to desired levels, in that scenario? Today we’ll use some historical data to measure the amount of risk accumulated in any one month of holding equities, and we’ll propose a way to prepare portfolios for major changes in the risk environment.
How much does volatility vary over time?
First let’s run a simple historical experiment. Suppose we look at the S&P 500® Total Return Index (SPTR) dating back to the beginning of 1990 and attempt to measure its risk. The traditional way of measuring risk is by calculating the volatility, or standard deviation of returns (daily frequency in this case), scaled to an annual level. By this metric, the SPTR experienced an annualized 18.3% volatility from 1990 to 2022. This translates to roughly 5.3% volatility per month, and as a result we might naively expect most months’ return to fall within roughly two standard deviations, or +/- 10.6%.
But that assumes monthly volatility is constant over time and that the 5.3% monthly volatility was just as accurate in the middle of the 2008 financial crisis as it was in the relatively calm months of 1998. This assumption is incorrect: While equities experienced 18.3% annualized volatility over our 33-year sample on average, there were many times over that period where volatility moved well above or below that 18.3%. For example, the monthly standard deviation of SPTR in March 2020 was 26.9%—or about 93% annualized. October 2008 wasn’t far behind, with a monthly volatility of 23.3%, or 81% annualized. On the other end of the spectrum, the sanguine month of November 2014 realized only 1.2% volatility, or 4.2% annualized. Neither extremely high nor extremely low volatility is likely to feel comfortable to equity investors looking for risk in the 15% to 20% range.
But this isn’t the only way we can look at time-varying risk in a portfolio. Perhaps it would be more natural to think about something we’ll refer to as market time. You’ve probably heard someone say something along the lines of “Whew, what a long year this week has been!” If you have, you know that while time might be linear, events are not. Some weeks feel like years, and some years feel like weeks.
The same is true for market risk. In a highly volatile year like 2008, investors experienced the equivalent of five years of risk from an average environment, which means market time had sped up. Similarly, in a low-volatility environment like 2005, investors experienced only a fraction of the typical year’s risk. Market time had slowed down.
Trailing one-year market time based on SPTR volatility, 1990–2022
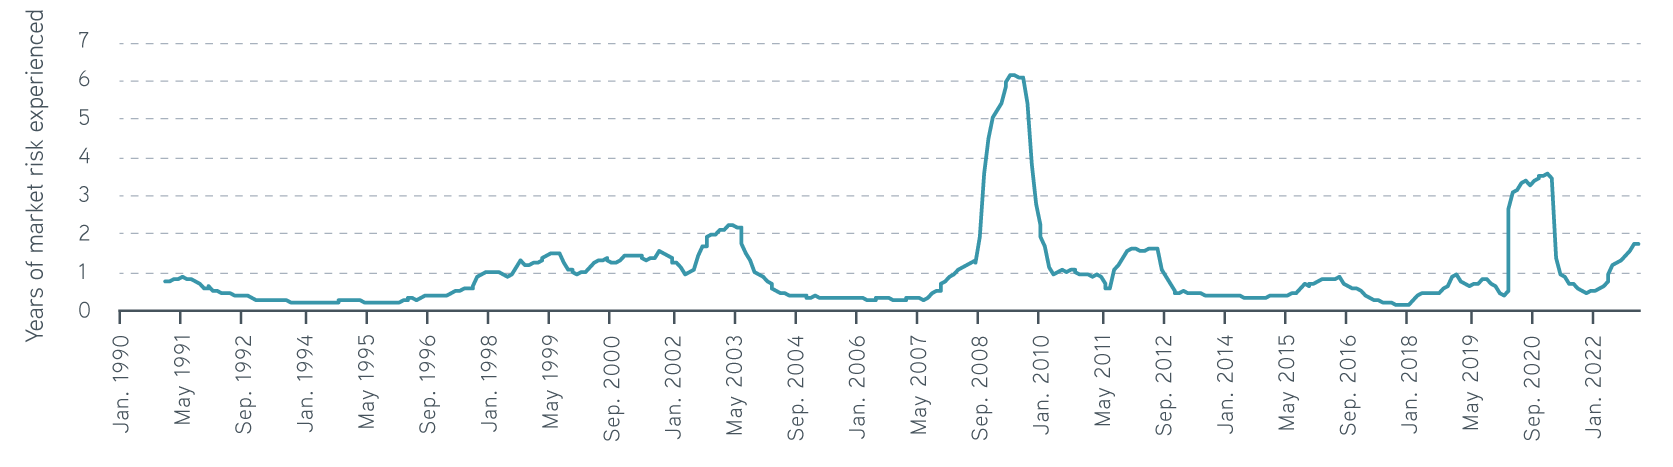
Sources: Refinitiv, Parametric, 12/31/2022. For illustrative purposes only. Past performance is not indicative of future results. Not a recommendation to buy or sell any security. It is not possible to invest directly in an index.
(A mathematical aside for interested readers: To measure market time, we use a concept called quadratic variation, which sounds technical but can be estimated simply by summing the squared daily returns. Over any given period, the accumulated risk is then calculated as the difference in quadratic variation from the start of the period to the end of the period. Within our sample, the average year will accumulate a certain amount of risk—equivalent to 18.3% standard deviation—and market time compares the accumulated risk of a period with that annual average. If a period has accumulated twice as much quadratic variation as an average year, we say that two years of market time has elapsed.)
While on average it takes a calendar year to experience a year’s worth of market time, not all periods are average. In one week alone, from the close of March 9, 2020, to the close of March 16, 2020, investors in SPTR experienced an entire year of market time. (Anyone else remember the year we had that week? I do.) The amount of risk unleashed that week was so severe it accounted for an entire year’s worth of the total risk of our 33-year period, a truly astonishing avalanche of risk likely only eclipsed by the 1987 market crash in most investors’ lived experience.
Time to accumulate years of market risk based on SPTR volatility, 1990–2022
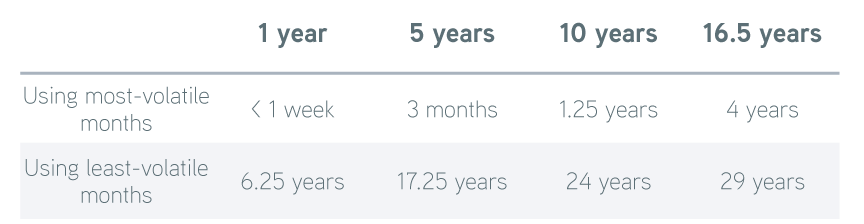
Sources: Refinitiv, Parametric, 12/31/2022. For illustrative purposes only. Past performance is not indicative of future results. Not a recommendation to buy or sell any security. It is not possible to invest directly in an index.
Sorting months by accumulated market time, we can see how quickly market time adds up in high-volatility periods and how slowly it adds up in low-volatility periods. In just three months in our sample—October 2008, November 2008, and March 2020—the SPTR accumulated five years of risk. It takes only the 15 most volatile months to account for 10 years of risk. Just four years of actual time bears half the total risk of our entire 33-year period.
On the other hand, when volatility falls, market time slows to a crawl. Put together, more than six years of the least volatile months only accounted for a single year of market time. This is remarkable in contrast to March 2020: That single week thundered down on investors the same risk as more than six full years of the sleepiest parts of our sample.
Customized overlays for institutional risk management
What is volatility targeting?
Both sides of this coin are challenging for investors: Someone looking for typical levels of equity risk is probably unhappy with either 2008 levels of supercharged risk or 2014 levels of bond-like risk. It can be hard to maintain the exposure in the first case, and, perhaps more insidiously, an investor is unlikely to achieve the level of return desired in the second. Fortunately, the solution is clear: increase allocations in low-risk periods and cut back in high-risk periods. In other words, volatility targeting.
Volatility targeting, at its simplest, is a straightforward response to this exact challenge. If the perceived risk of the asset is half of the desired level, investors should increase the allocation until the risk is back to its target. If instead the perceived risk is double the desired level, investors should cut positions until risk is back to target. Simple, straightforward, and transparent.
Consider one possible source of volatility over the coming month. As we near the point where the Treasury can no longer service existing debt, unless an agreement is reached, we’ll likely see volatility rise in response. To maintain a constant level of risk, a volatility-targeting program will begin to cut exposures. Eventually the situation must be resolved one way or the other. In the case of a messy default, we can expect sharply increased market volatility. In the case of a deal, volatility might recede with a sigh of relief. In either case, a good volatility-targeting program is prepared to add or remove exposures systematically, with the goal of maintaining consistent and comfortable levels of risk for the investor.
The bottom line
Parametric builds systematic, customizable, rules-based solutions for volatility targeting, helping investors to scale allocations up or down depending on the volatility environment. With another jolt of acute risk possibly appearing on the horizon, now is the time to get a plan in place. All investors should be prepared to withstand whatever events move the markets, well before those events occur.